Information reports
The reports that accompany new statistics: list filters, the structure of a report page, interactive charts and PDF export.
Last updated on
Information reports are the texts in which the State Data Agency presents statistics it has just released: "Results of the population health statistical survey", "Overview of the labor market" and the like. Unlike data insights, these are full articles with charts, tables and explanations.
Notifications or Information reports?
The News menu calls this section Notifications; the section's own page is headed Information reports. They are the same thing.
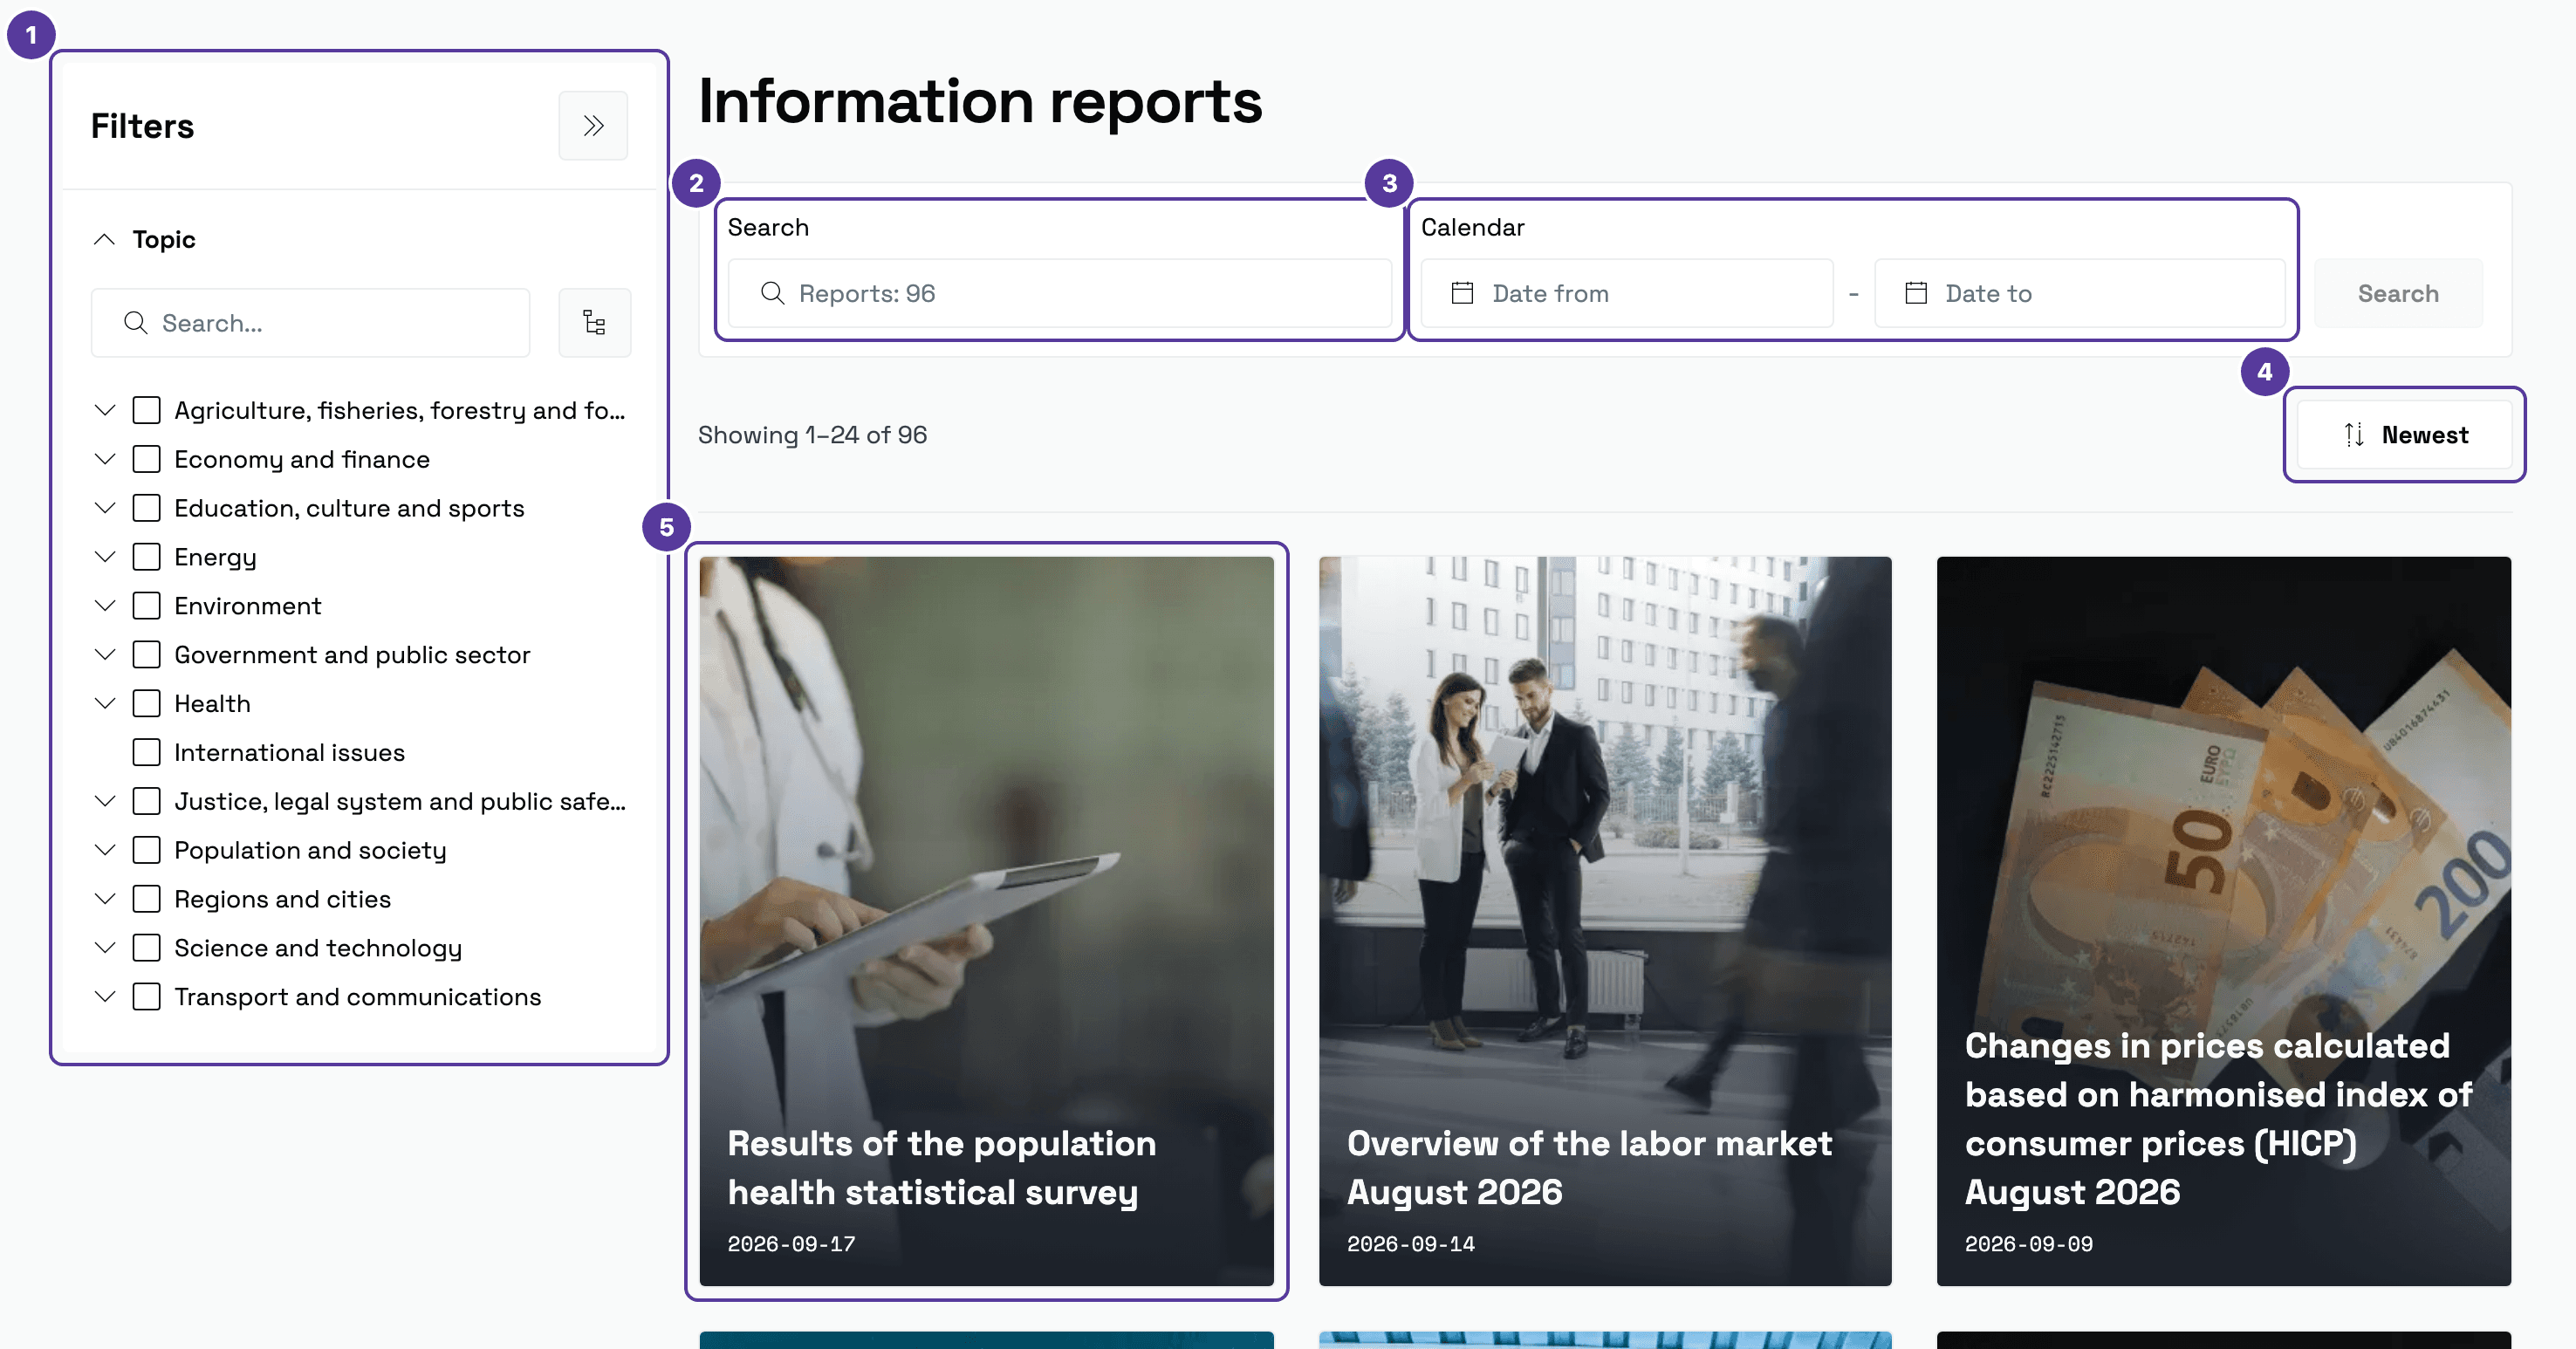
The list and its filters
- Filters — a Topic group with the same 13 data topics as the catalogue.
- Search — part of a title or of the text; the placeholder gives the total number of reports.
- Date range — Date from and Date to, applied with the Search button.
- Sorting — Newest.
- A report card — a photograph, the title and the publication date. Page numbers are at the bottom of the list.
A report page

- Breadcrumb — Home / Information reports / title; a quick way back to the list.
- Publication date.
- Export PDF — downloads the report as a PDF, with its charts.
- Link icon — copies the report's address to the clipboard.
- Share icon — offers to share the report.
The title, the illustration and the text itself follow.
Interactive charts
Charts in reports are not pictures — they can be explored. Depending on the subject, buttons under a chart let you:
-
turn individual series on and off (for example, Very good and good, Average, Bad or very bad);
-
switch between years (2014, 2019, 2025);
-
choose a population group (Total, Women, Men).
Hovering over a chart shows the exact value.
From the report to the data
A report explains what the statistics show, but it does not let you recalculate them your own way. When you need the figures themselves — other breakdowns, a longer time series or a download — find the dataset in the catalogue or open the dataset table.
Tips & tricks
- Need the report for a document? Export PDF produces a tidy version with the charts — no screenshots required.
- Interested in one subject area? Tick a Topic and save the address; coming back shows only that area's reports.
- The portal's homepage also lists the newest reports, in its Information reports section.
How is this guide?