Data insights
Analytical comments on the latest indicators: how to read an insight, filter by topic, and how insights differ from information reports.
Last updated on
Data insights are short analytical comments on the latest official statistics. Each says in a couple of sentences what the figures show: how much, when, and how it changed.
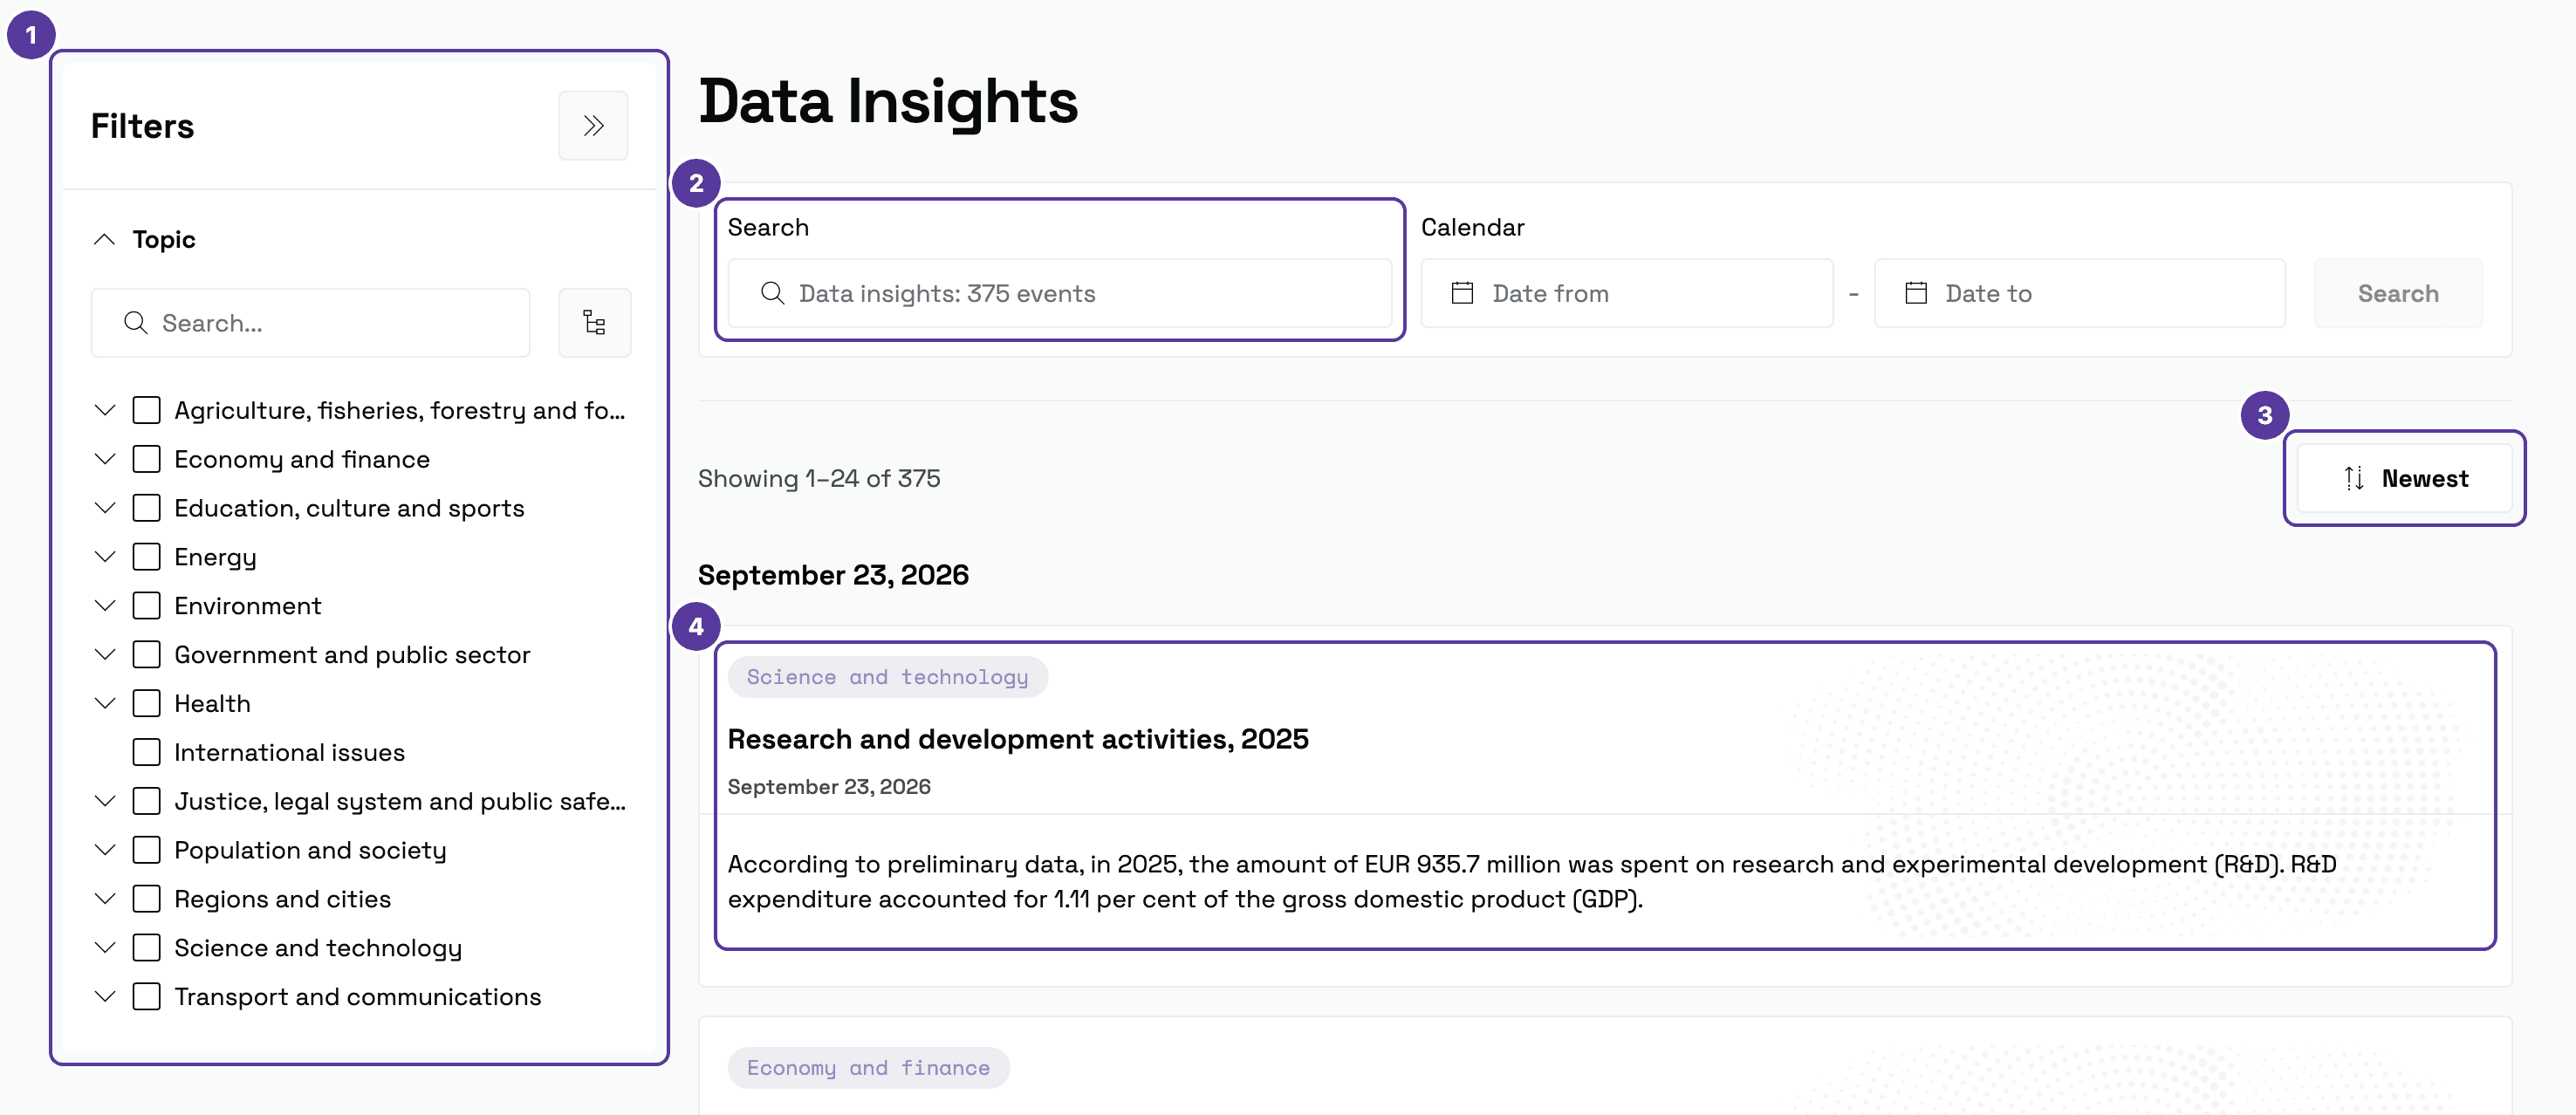
- Topic — in the filter panel. Topics form a tree: the arrow beside a topic expands its sub-topics, so you can narrow further than the 13 main areas. The group also has a search box.
- Search — a word from a title or a comment; the placeholder gives the total number of insights.
- Sorting — Newest. To its left, a line shows which part you are seeing ("Showing 1–24 of …"); page numbers are at the bottom. The period is set with Date from and Date to and the Search button.
- An insight card — the whole insight, read straight from the list.
How to read an insight
Insights are read in the list — they have no page of their own, so there is nowhere to click through to. A card carries:
-
A topic tag (lilac) — the subject area, for example Science and technology or Economy and finance.
-
The title with its period — for example, "Research and development activities, 2025".
-
The publication date.
-
The comment — one or two sentences with the key figures. For example: "According to preliminary data, EUR 935.7 million was spent on research and development (R&D) in 2025. R&D expenditure accounted for 1.11 per cent of gross domestic product (GDP)."
Entries are grouped by day, newest first.
How they differ from information reports
| Data insights | Information reports | |
|---|---|---|
| Length | One or two sentences | A full article |
| Where you read it | Straight from the list | On its own page |
| Charts | None | Interactive charts and tables |
| No | Export PDF | |
| Good for | Seeing quickly what changed | Understanding context and detail |
From an insight to the data
The figure in an insight is a summary value. When you need a time series, other breakdowns or a download, find the dataset in the catalogue — smart search, where you can type a whole question, helps too.
Tips & tricks
- Following one subject area? Tick a topic and save the browser address — the filter travels with it.
- The portal's homepage also shows the newest insights.
- If an indicator mentioned in an insight matters to you regularly, check when it is updated in the calendar.
How is this guide?