The data table
Exploring a dataset on the portal: views, pages, sorting, column and row filters, the structure and conventional symbols.
Last updated on
On the Data tab a dataset is shown as a table you can explore right in the browser, without downloading a file. All of the preview controls sit above the table and in its column headers.
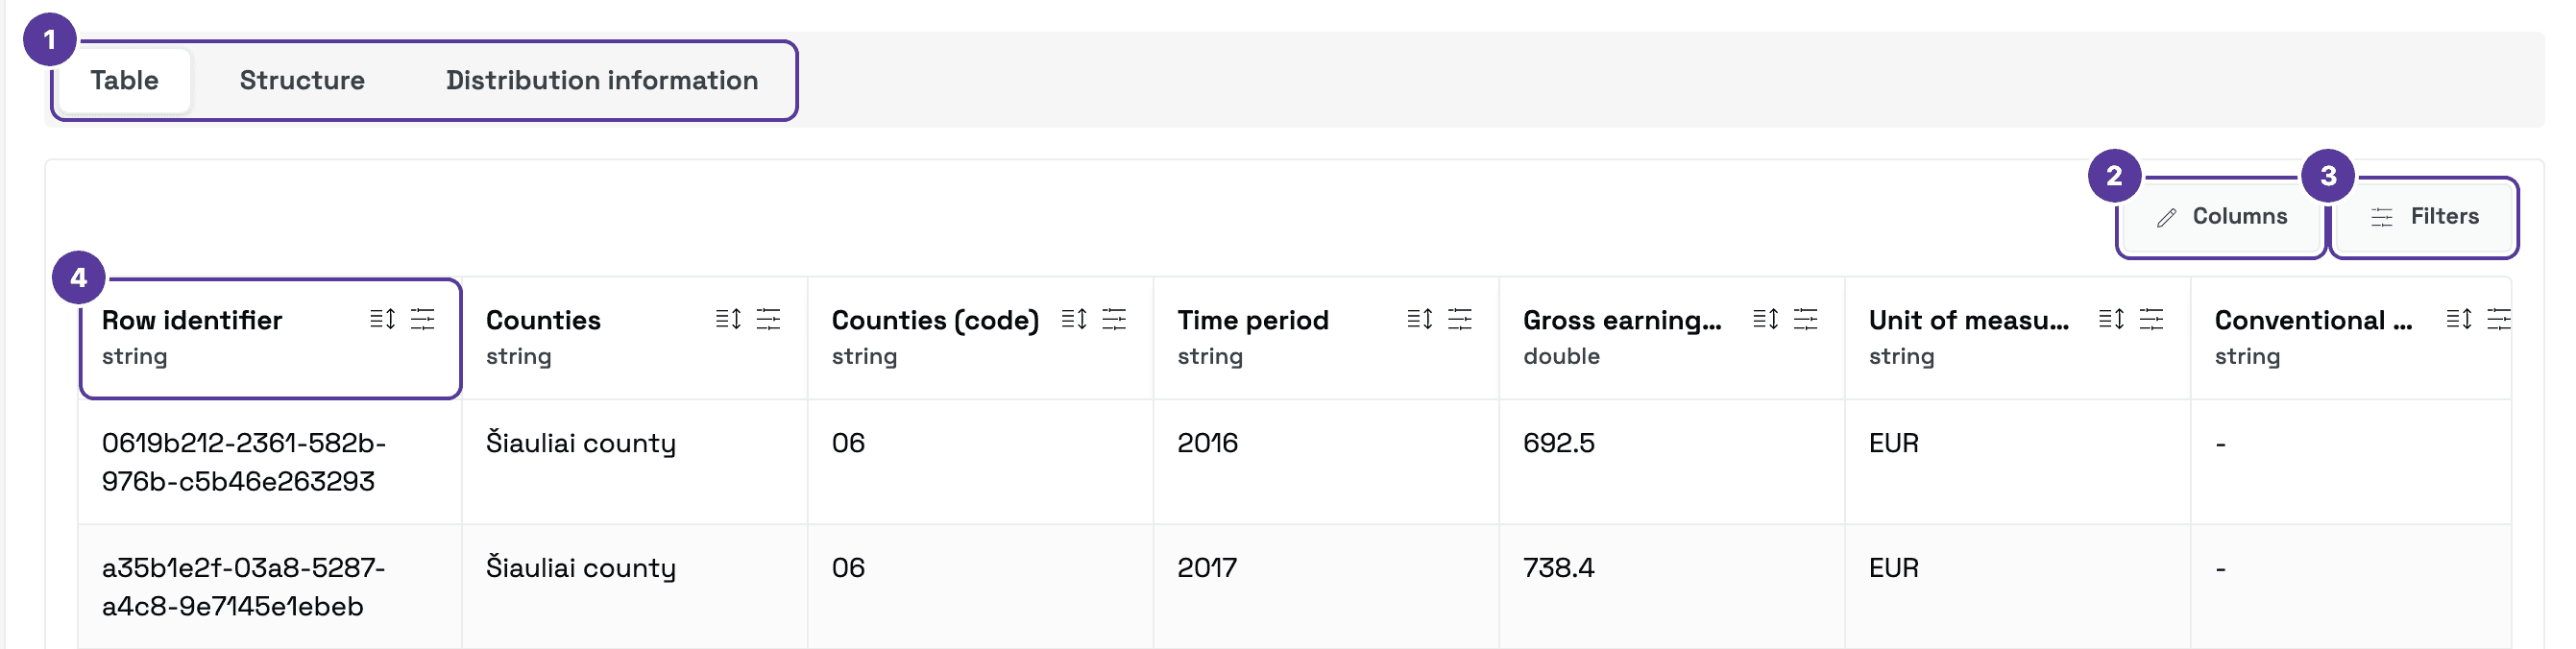
- Views — three ways to display the dataset.
- Columns — which columns to show.
- Filters — filtering the rows.
- A column header with its data type (here Row identifier, type
string) and the sort and filter icons. Every column has one.
Above the views, in the table's header, are the Export button (see Downloading) and a Collapse arrow that hides the table.
Views
Above the table (1) you switch between three displays:
| View | What it shows |
|---|---|
| Table | Rows and columns — the main view. |
| Structure | How many rows and columns the dataset has, and each column's title, API name and type. See Structure. |
| Distribution information | Technical details of this distribution: identifiers, the API link, formats, licence. See Distribution information. |
Pages
The table is shown a page at a time. Below it you see which rows are shown (for example, 1–24 of 390), the page numbers and a Per page list — 24, 48 or 96 rows.
Sorting
On the right of every column header (4) are two icons. The sort icon cycles through the order:
-
first click — ascending;
-
second click — descending;
-
third click — back to the original order.
The sort order, the filters and the page you are on are written into the browser's address bar, so copying the address shows someone else the same view.
The column menu
The filter icon in a header opens that column's menu:
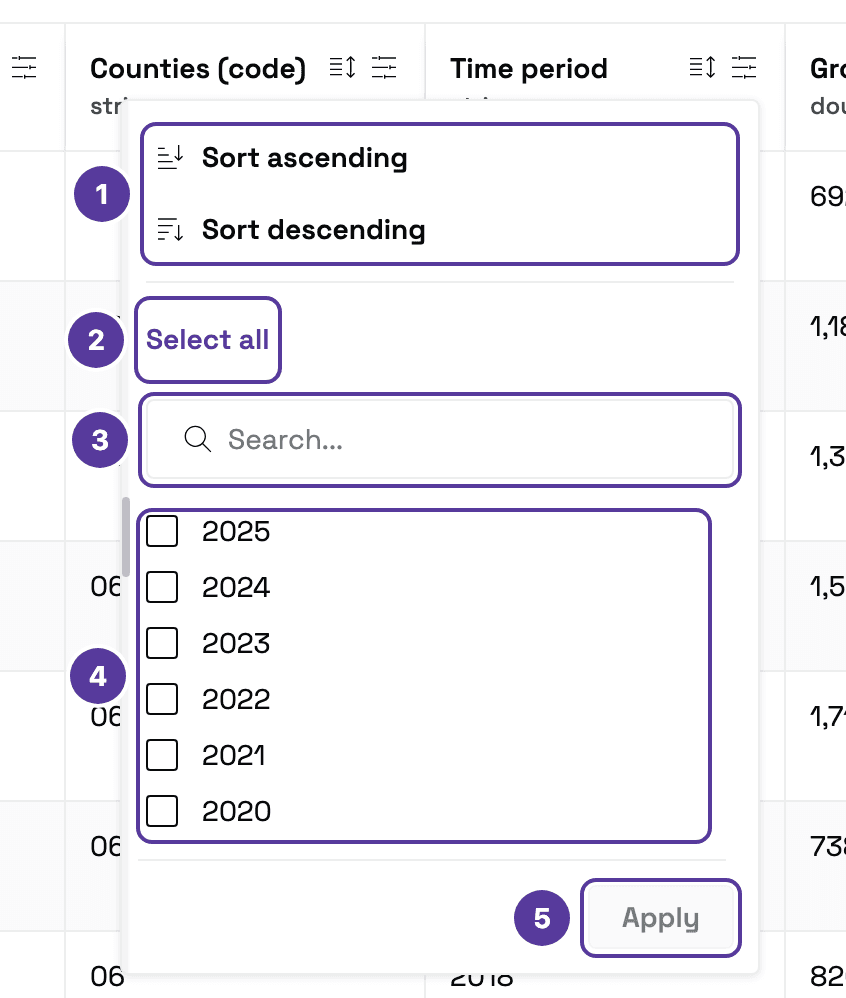
- Sorting — the same as the sort icon.
- Select all — ticks every value (once all are ticked, it switches to clearing them).
- Search — finds a value in a long list quickly, one municipality for example.
- Values — tick the ones you want to keep.
- Apply — filters the rows.
In a numeric column (type double or integer) a Number filter replaces the list of values: enter the lowest and highest value. There you can also Hide empty values, and Restore returns to the full range.
Columns
The Columns button (2) opens the Column editing side panel, where each column under Active columns can be switched on or off.
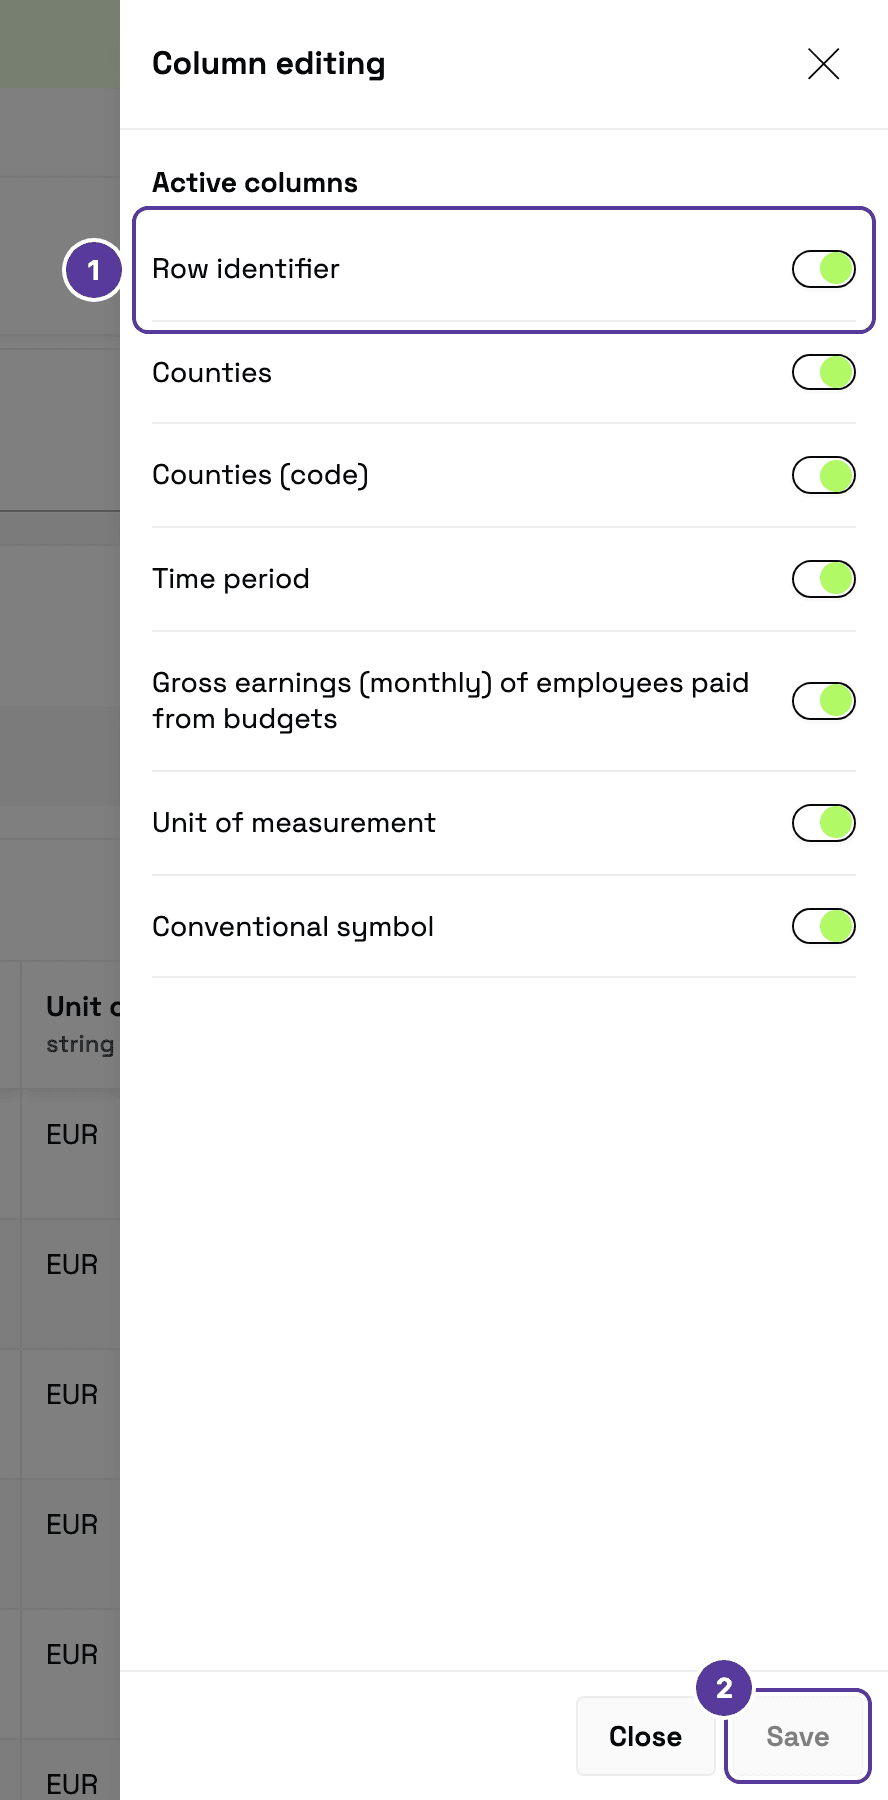
- A column toggle — a column that is on (green) is shown, one that is off is hidden. Here Row identifier is marked.
- Save — applies the changes (Close dismisses the panel without changing anything).
Tips & tricks
- Turn off the "Row identifier". The table opens with a technical code (for example
fc9ff094-fe94-…) meant for systems, not for reading. In Column editing, switch off its toggle and click Save — especially on a phone, where this column fills the whole first screen.
Under each column header (4 in the image above) is the data type: string for text, double for a decimal number, integer for a whole number.
Row filters
The Filters button (3) opens a side panel with every column in one place — handy when you filter by several columns at once, such as one year and one county.
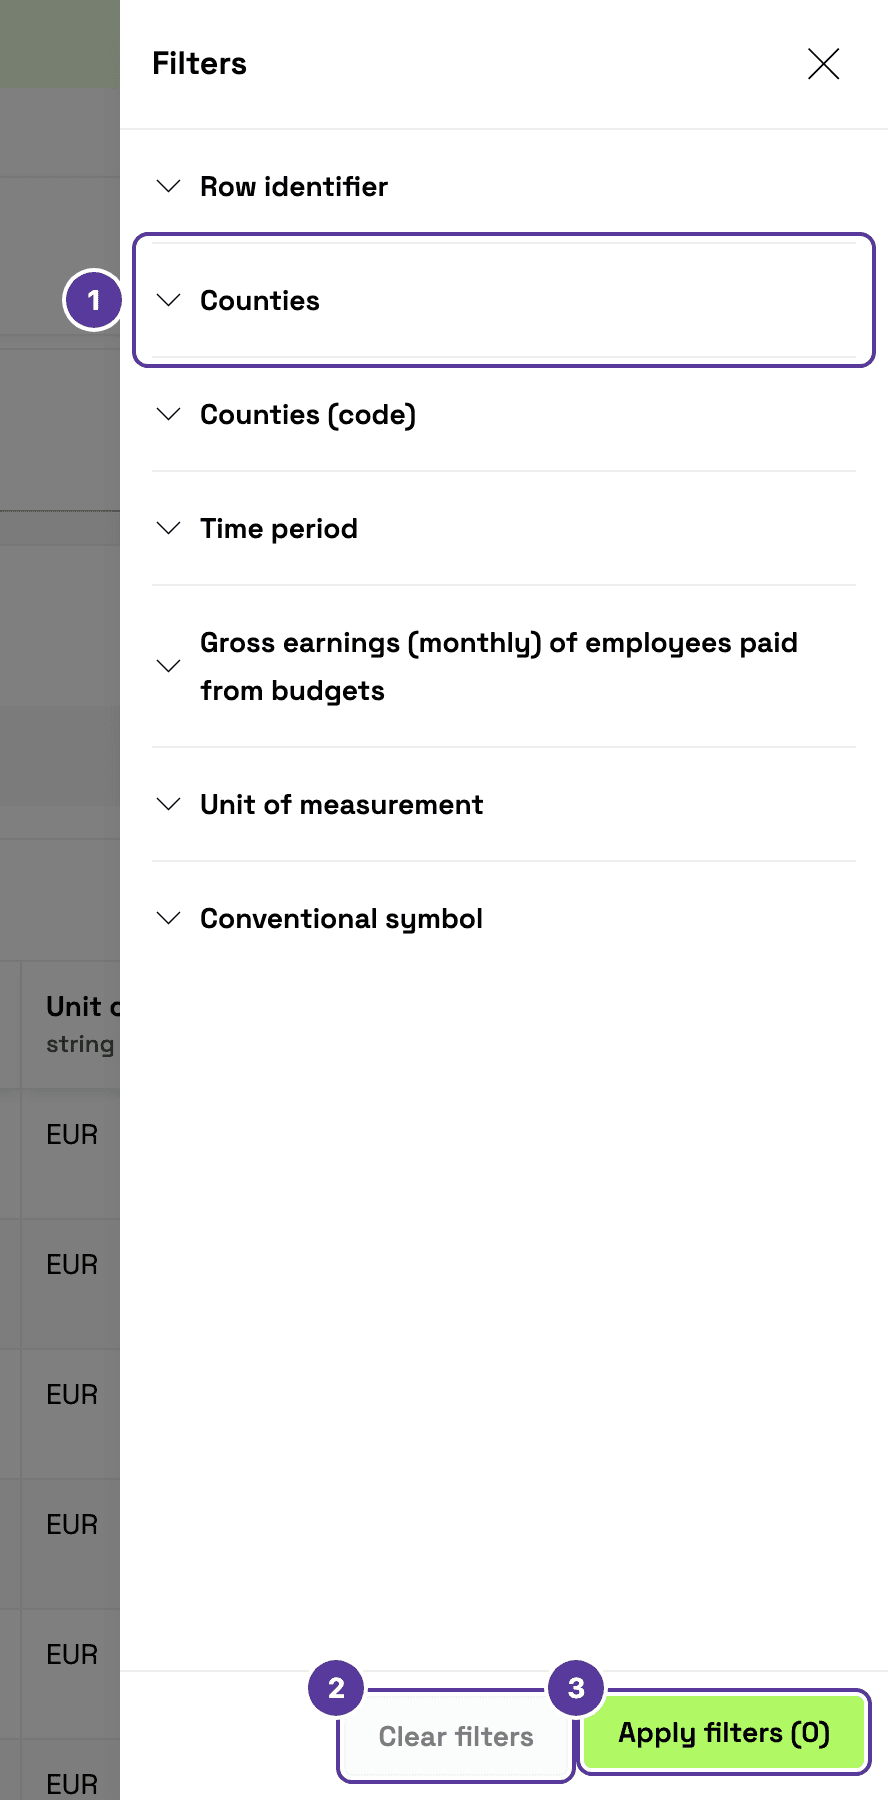
- Each column is an expandable row; click it to reveal the same conditions as in the column menu.
- Clear filters — removes every filter in one click.
- Apply filters — applies your choices; the number in brackets shows how many filters are currently active.
Filters matter beyond the preview: on export you can choose whether to download all data or only the filtered data.
Empty values and conventional symbols
A dash - in a cell means the cell is empty. When the indicator's value itself is empty, the Conventional symbol column explains why, in words — for example, that the indicator is not calculated for that combination, that data is not available or that it is confidential. The same column also flags values that are provisional or revised. A - in the Conventional symbol column means there is no note for that row.
Structure
The Structure view shows the row count and column count at the top, and below them a table of every column:
| Column | What it shows |
|---|---|
| Title | The column's name in the table, for example Time period. |
| API name | Its technical name, for example time_period — use it in queries through the API. |
| Data type | string, double or integer. |
Want to know what exactly an indicator measures? That is explained not here but in the documentation on the Metadata tab.
Distribution information
The Distribution information view holds the technical details of this distribution — the table in one language:
-
Identifier and Another identifier — for example
sdr003146_enand the statistical table codeS3R640_M3060807_1_en; -
Language, Description and Status;
-
Access URL — the API address with a copy button — Access service and Availability level;
-
Format (for example Parquet, CSV, JSON), Media type, Packaging format, Size and Checksum;
-
Publish date and Modified date;
-
License, Applicable legislation, ODRL policy and Distribution rights;
-
Spatial resolution, Temporal resolution and Linked schemas.
Most of these fields repeat the metadata; here they describe the specific table, such as its language and API address.
Once you have what you need, move on to downloading.
How is this guide?