Use cases
Dashboards and other data products: where to find them, how to narrow them down and open them.
Last updated on
Use cases — the portal also calls them data products and lists them as Data reuses — show how the data published on the portal is put to work: in dashboards, reports, maps or publications. For now, every use case is an interactive dashboard.
Where to find them
-
The Data and statistics menu → Data products. It has three items:
-
Browse the catalog — the list of all use cases (described below).
-
About data products — what data products are, who they are for, and frequently asked questions.
-
Sustainable development goals (SDGs) — a separate website, dvr.stat.gov.lt.
-
-
Smart search — tick the Data reuses filter.
-
The dataset page — the Data reuses tab (usually empty for now).
The list of use cases
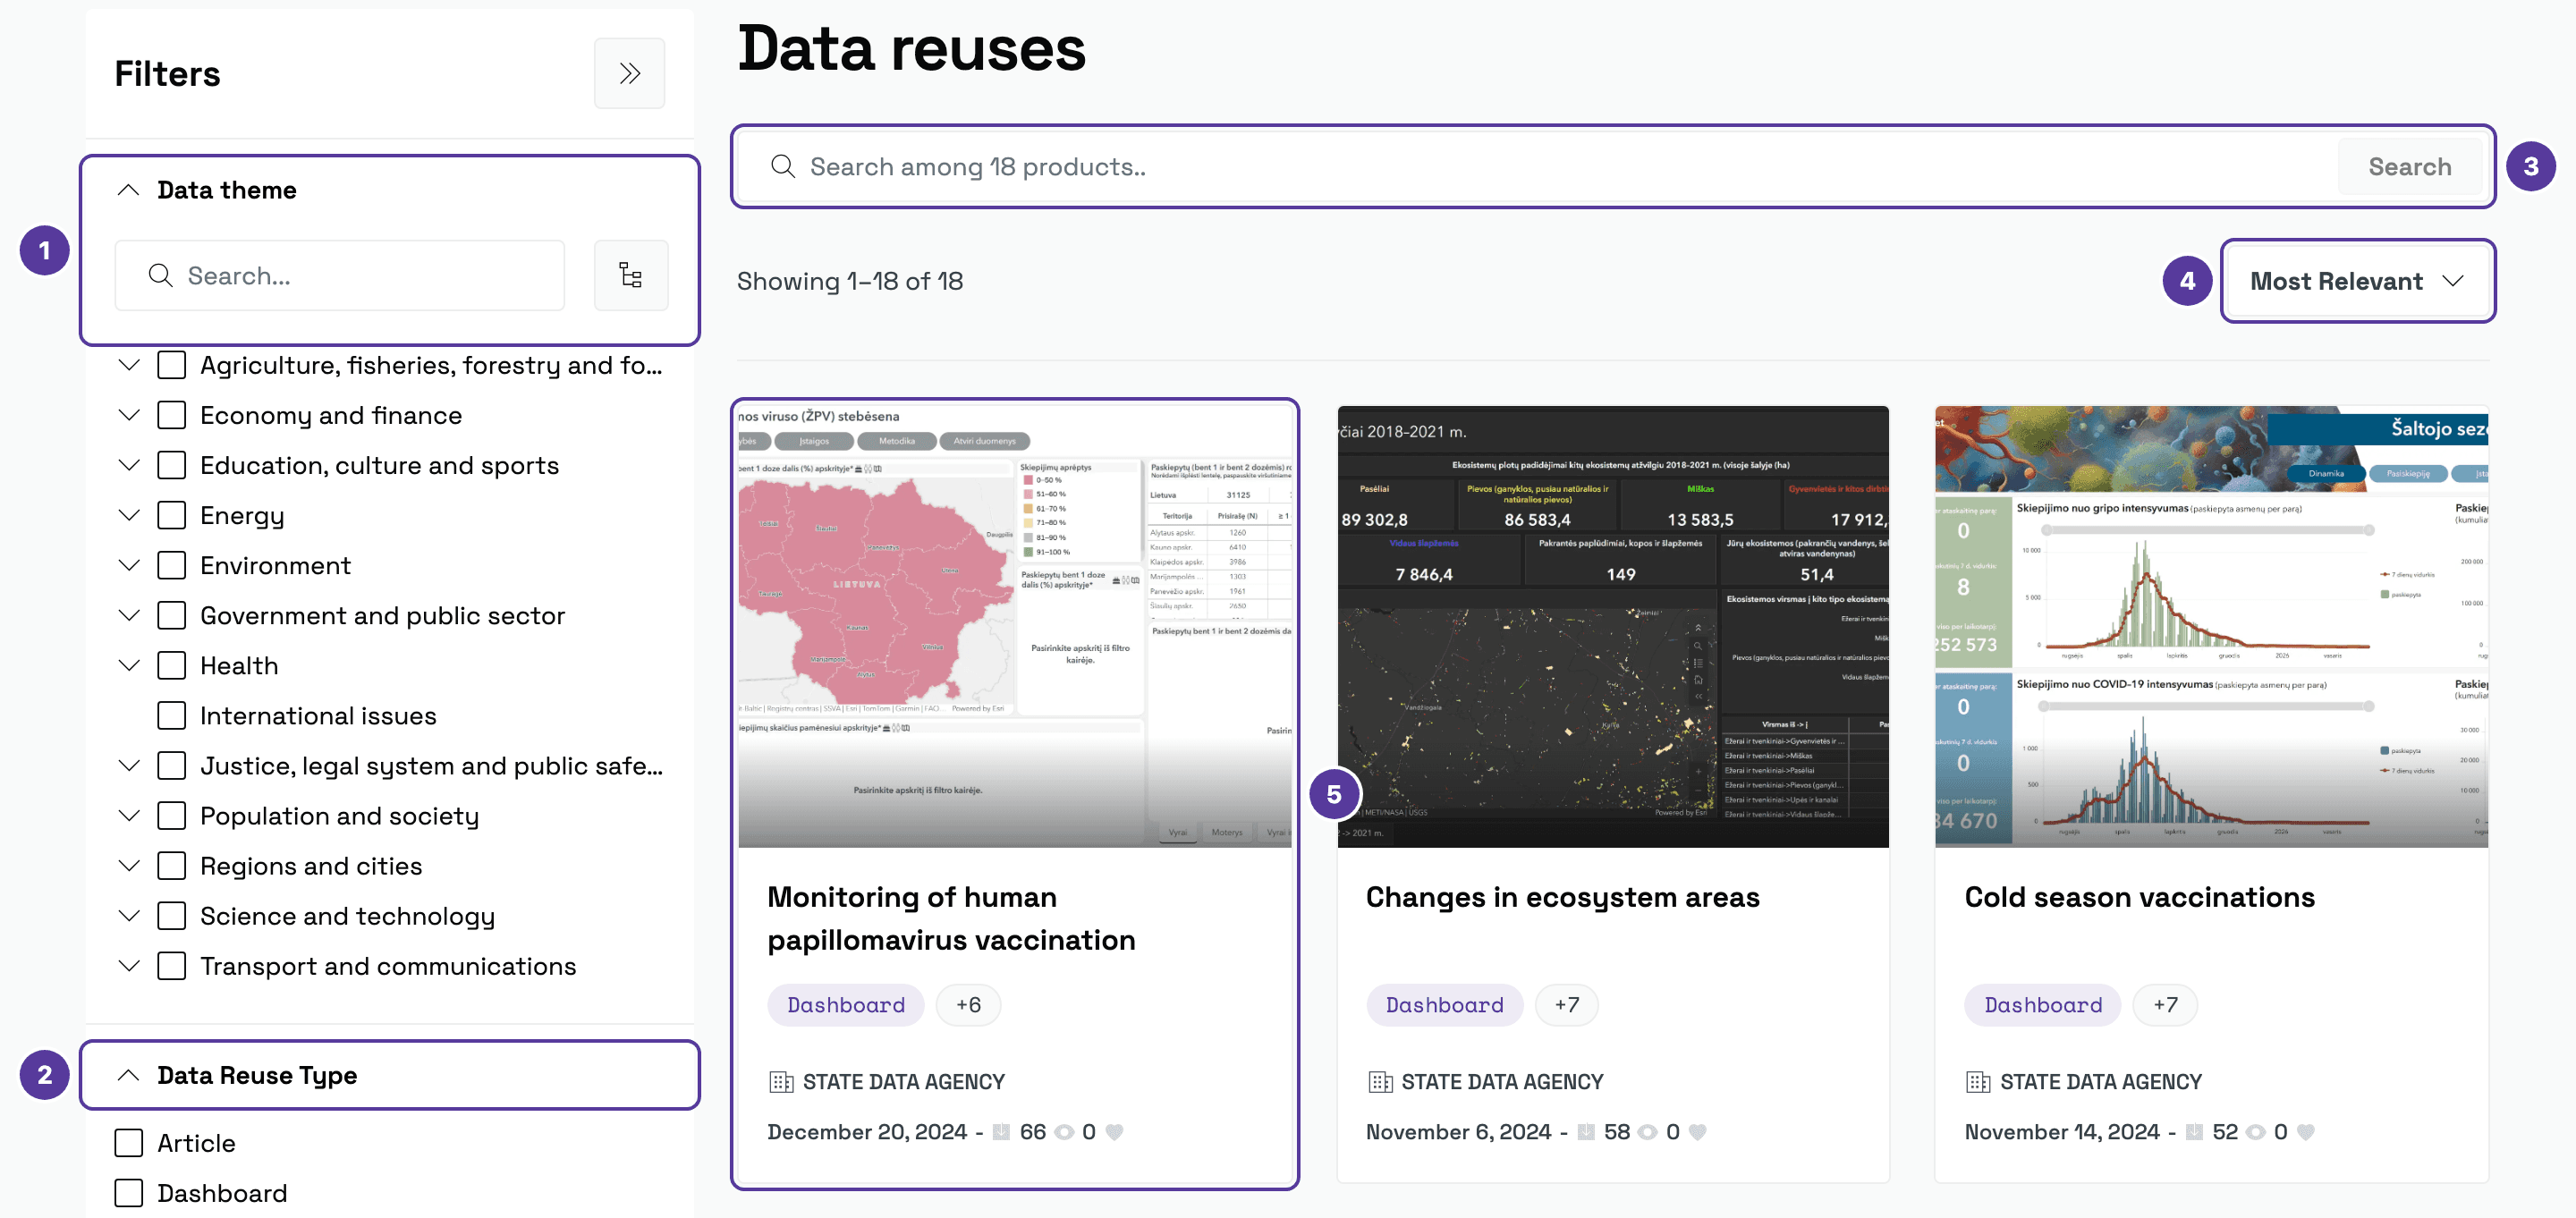
- Data theme — the themes form a tree: the arrow beside a theme expands its sub-themes. The group has its own search box.
- Data Reuse Type — Article, Dashboard, Data application, Infographic, Map / atlas, Public release, Publication, Report, Research paper and Other.
- Search across all use cases.
- Sorting — Most Relevant, Newest, Oldest, Title A-z or Title Z-a.
- A use-case card — a preview, the title, the type, the publisher, the publication date and counters. “+6” means six more keywords: hover over it to see them.
The use-case page
Click a card to open the use-case page:
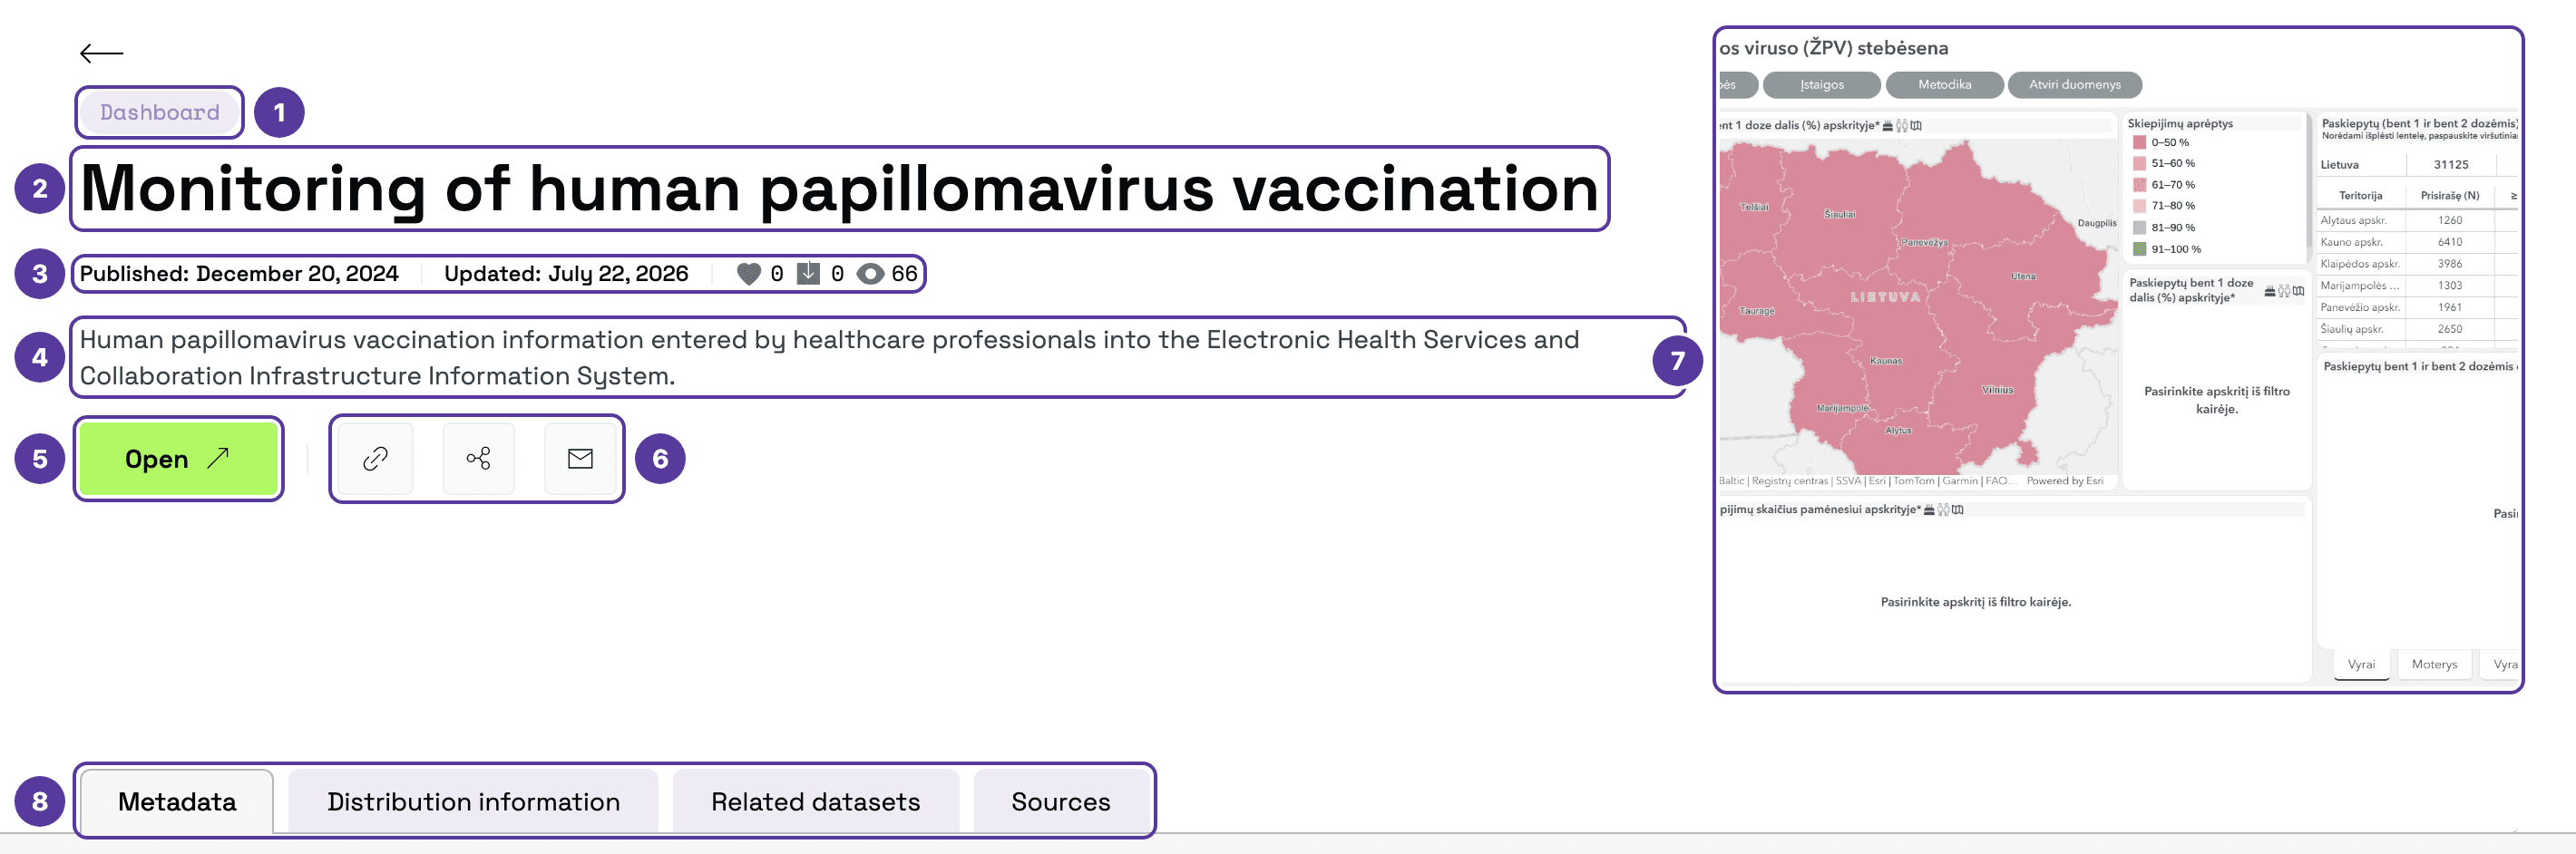
- Type — for example, Dashboard.
- Title.
- Publication and update dates, and the number of likes, downloads and views.
- Description — what the use case shows and where its data comes from.
- Open — opens the product itself (see below).
- Copy link, Share and the Feedback form — the same as on the dataset page.
- Preview — what the product looks like.
- Tabs — described below.
| Tab | What it holds |
|---|---|
| Metadata | Creator and publisher, identifier (for example, DR000005), keywords, theme, access rights, geographical coverage, and publication and modification dates. |
| Distribution information | How the use case is delivered: the format (for dashboards, HTML), the access link and the licence. |
| Related datasets | The datasets the use case is built from. |
| Sources | Where the data came from. |
Below the tabs are other use cases by the same creator.
Not every tab is filled in
For now, the Related datasets and Sources tabs usually show “No data found” — the information has not been provided yet.
Opening a use case
Open opens the product itself. Where it opens depends on the product: dashboards currently open inside the portal, on their own page (its address ends in /dashboard), while other products — a publication or an application, for example — may be on an external website.
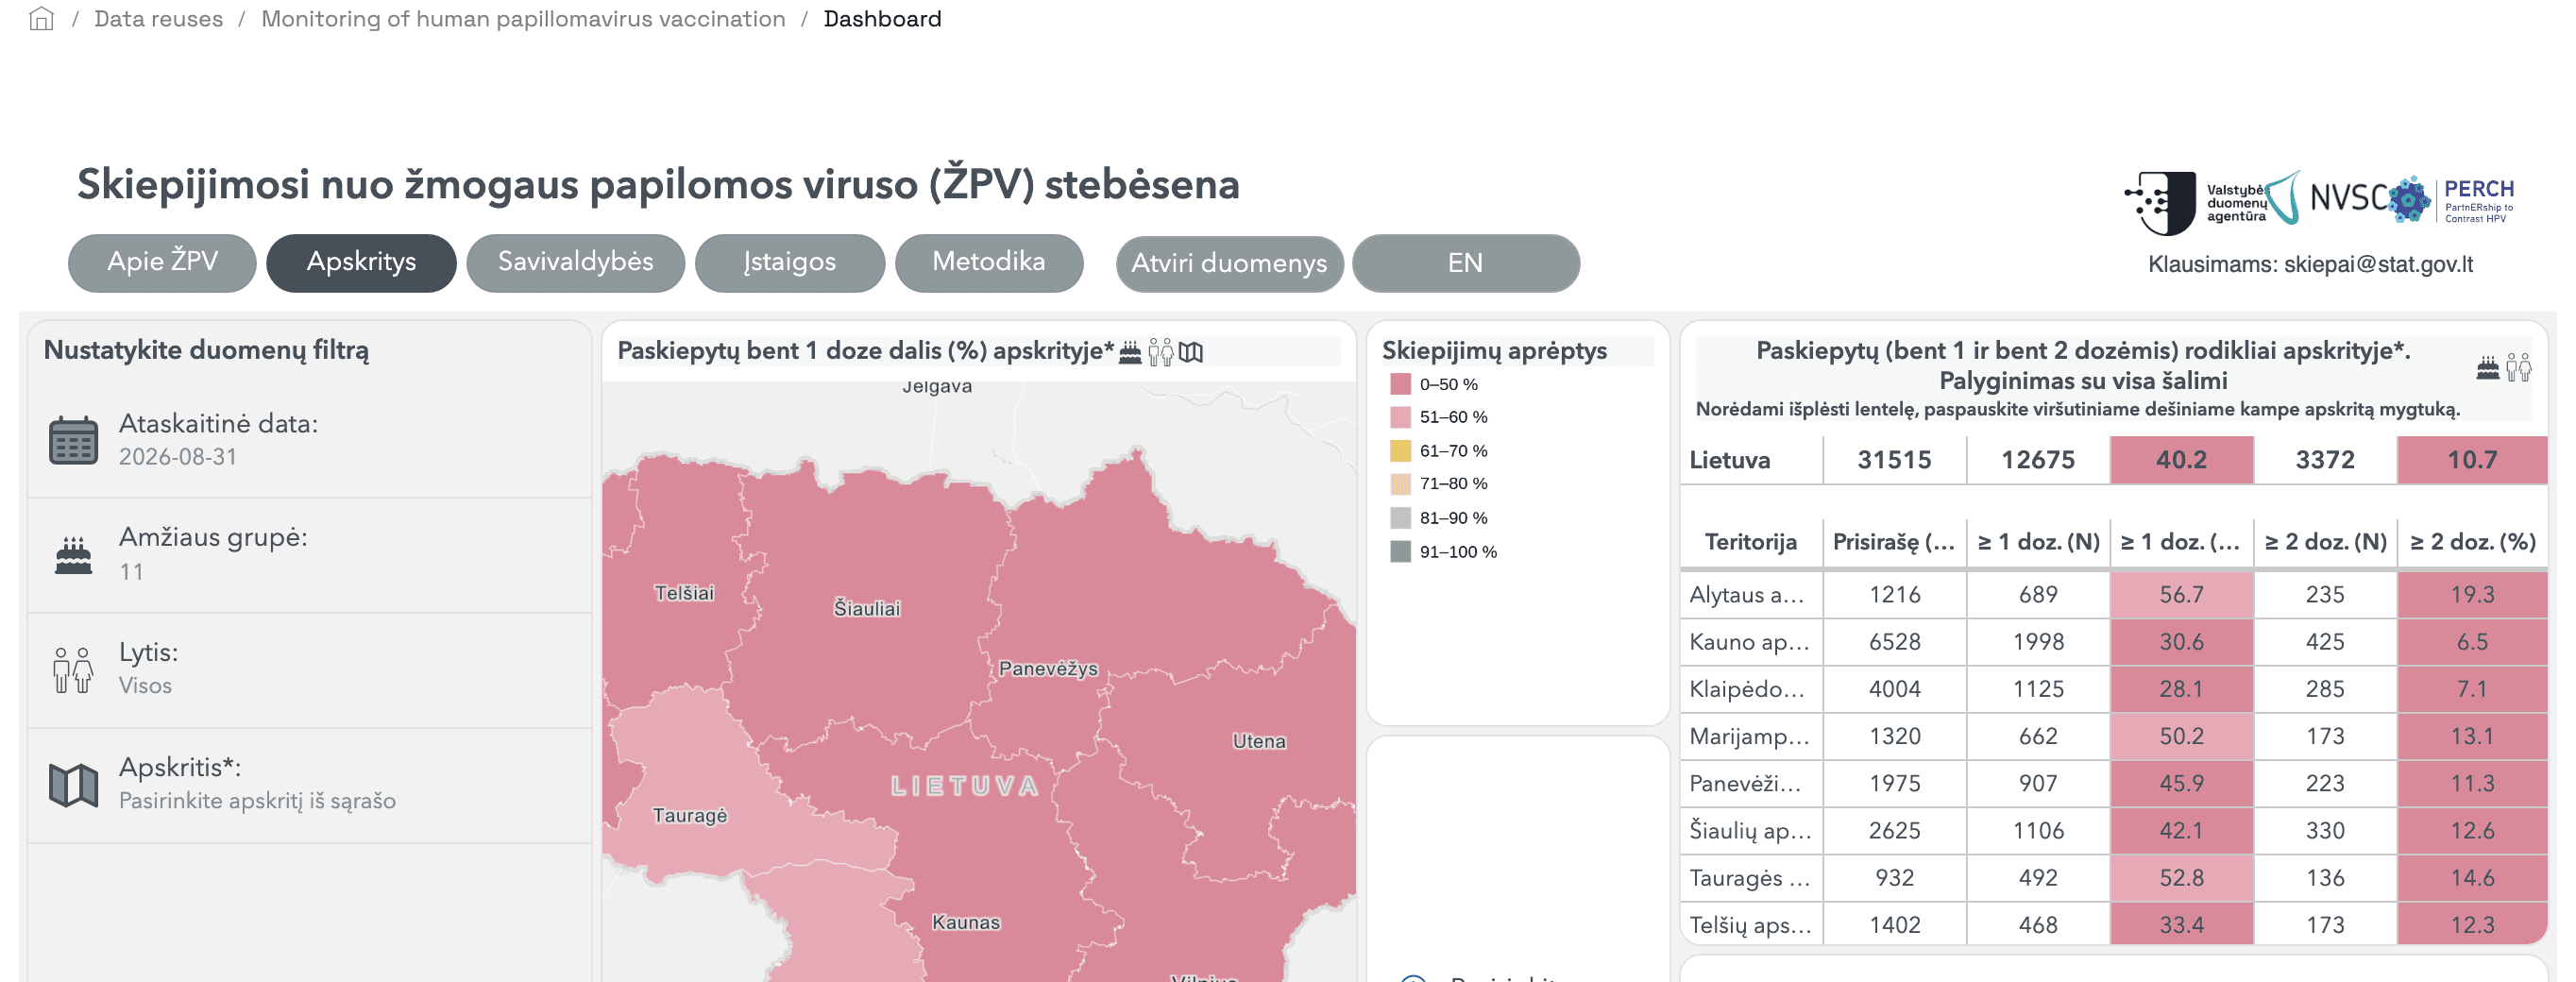
A dashboard is interactive: its filters, maps and tables belong to the dashboard itself, so each one looks different. Below it is a More Dashboards strip with other use cases. If you see “Failed to load content” instead of the dashboard, click Refresh.
Dashboards are in Lithuanian
The dashboards themselves are in Lithuanian even on the English portal. Some have their own EN switch at the top.
Tips & tricks
- Want to share a dashboard? Copy the use-case page's address with Copy link.
- Need the figures themselves? Find the indicators shown in a dashboard in the catalogue or with smart search — there you can download them.
How is this guide?