The dataset page
What a dataset page shows: the description, publisher, citing, metadata, licence and update history.
Last updated on
When you open a dataset, its title sits at the top, and around it is the information you need to decide whether the data suits you.
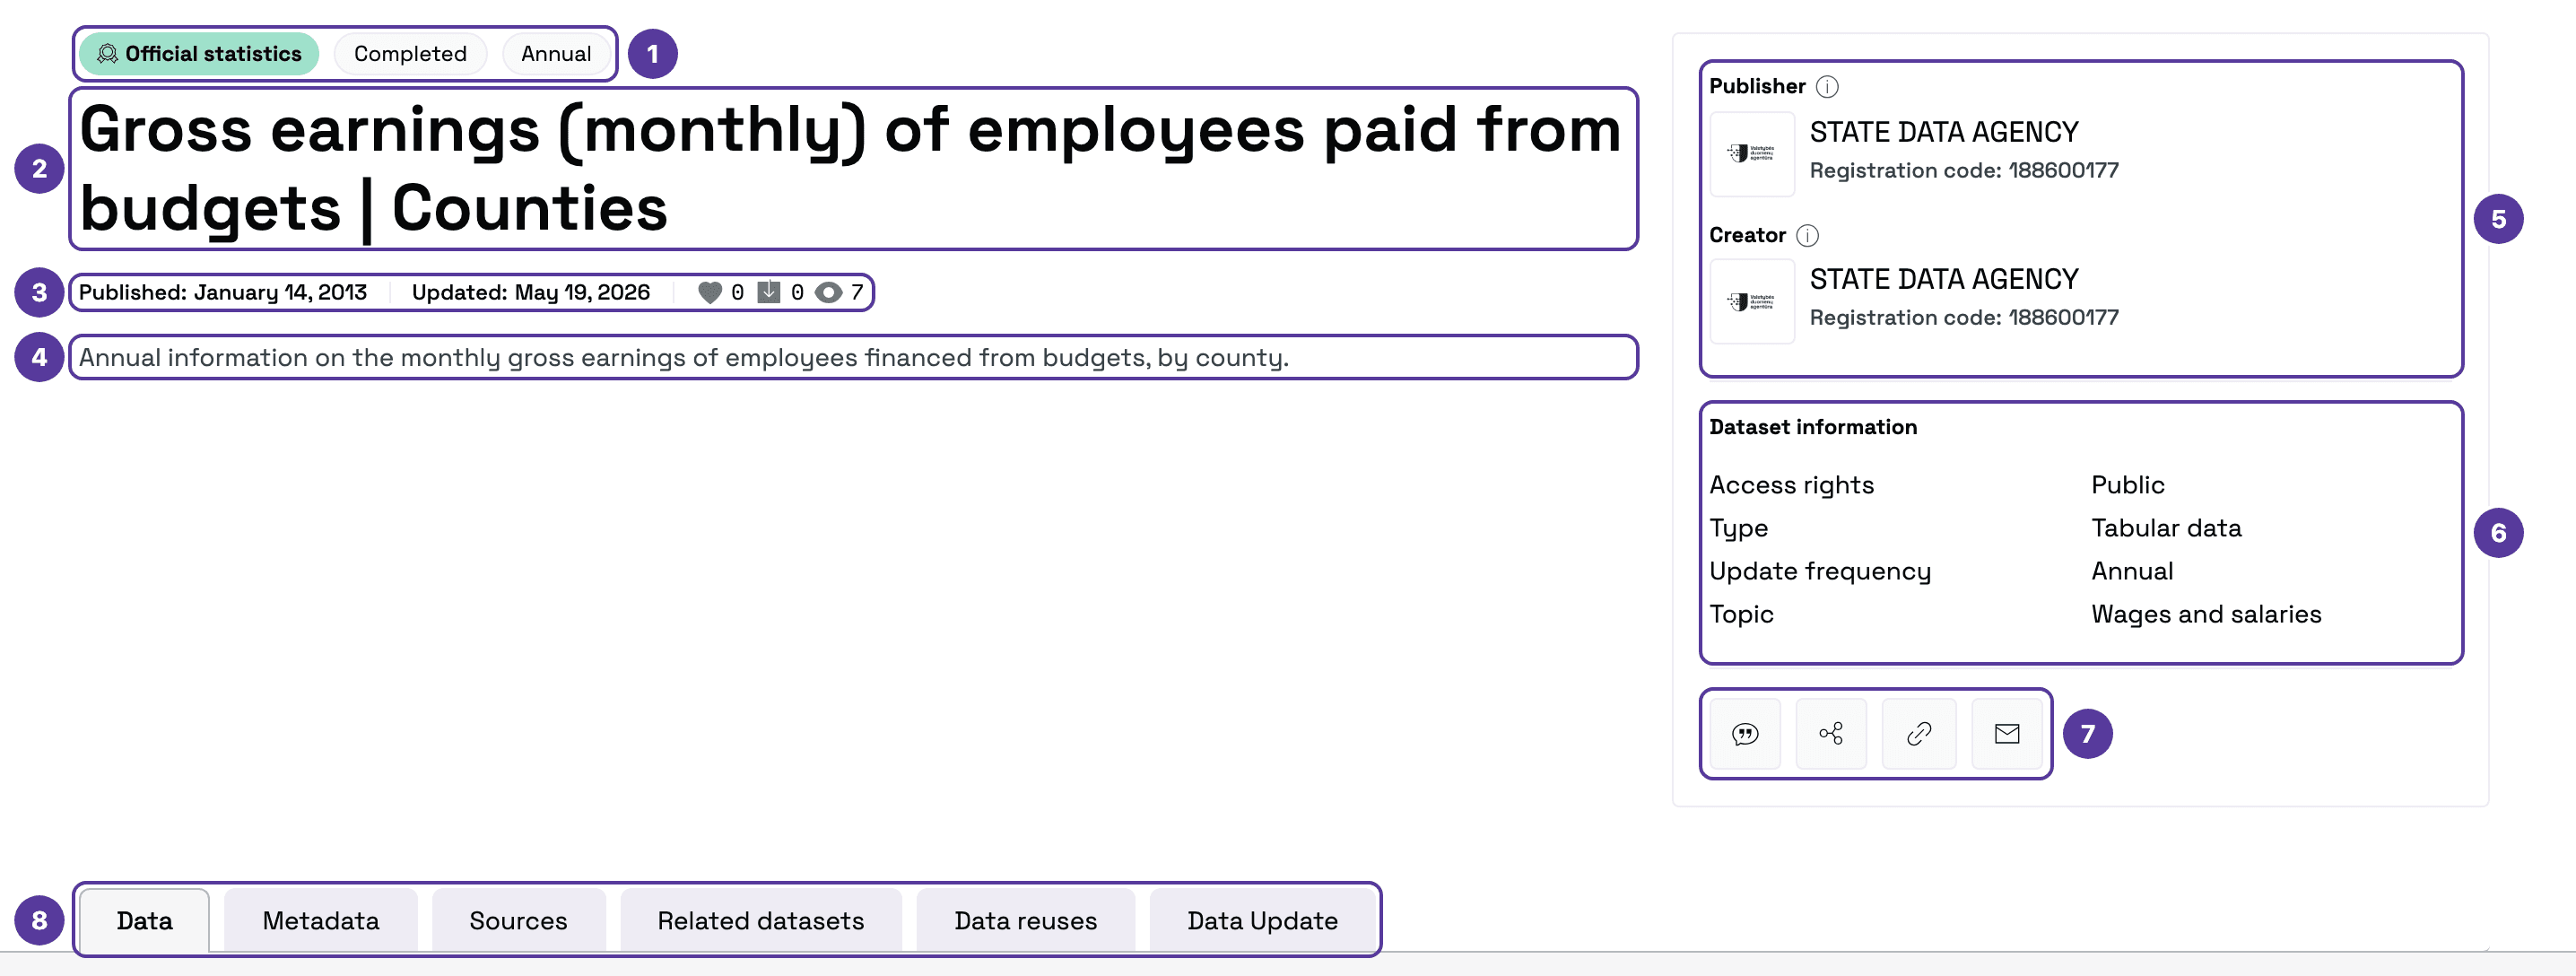
- Category, status and update frequency — the same tags as in the catalogue.
- Title — first the indicator, then the breakdowns after “|”.
- Publication and update dates, and the number of likes, downloads and views. The update date matters more — it shows when the data last changed.
- Description — what the dataset covers.
- Publisher — the institution that published the dataset on the portal — and Creator — the institution that produced the data. Often they are the same.
- Dataset information — access rights, type, update frequency and topic.
- Actions — cite, share, copy the link and send feedback. Described below.
- Tabs — the data, metadata and more. Described below.
Cite, share, give feedback
Below the dataset information are four buttons:
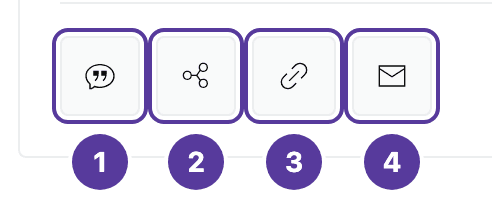
- Cite — choose a format: EU Data Citation, APA, Harvard or Vancouver.
- Share — via Facebook, LinkedIn, X, Messenger or email.
- Copy link — copies the dataset's address.
- Feedback form — leave feedback about this dataset: your full name, email and a message (up to 2,500 characters), then Send.
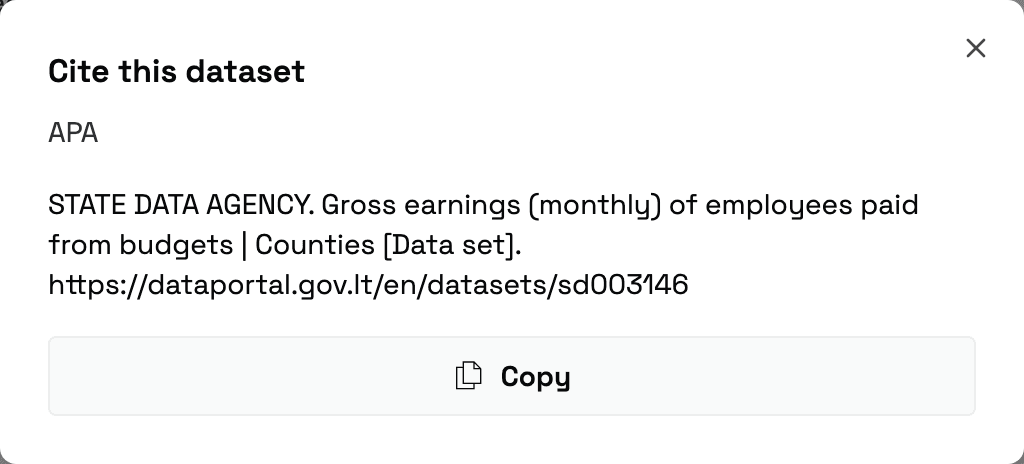
Choosing a citation format opens a window with a ready-made citation — copy it with Copy:
Tabs
The dataset's content is split into six tabs. The first, Data, opens by default.
Data
The data table itself. It is shown in the language you are browsing in — on the Lithuanian portal its name ends in “(lietuvių k.)”, on the English one in “(English)”. The table header says when it was updated and which formats it can be downloaded in.
Above the table you switch views (Table, Structure, Distribution information) and use Columns and Filters to choose what to show — see The data table. The Export button downloads the data — see Downloading.
Metadata
A full description of the dataset, in six groups. Some fields have an ⓘ icon — hover over it to see what the field means.
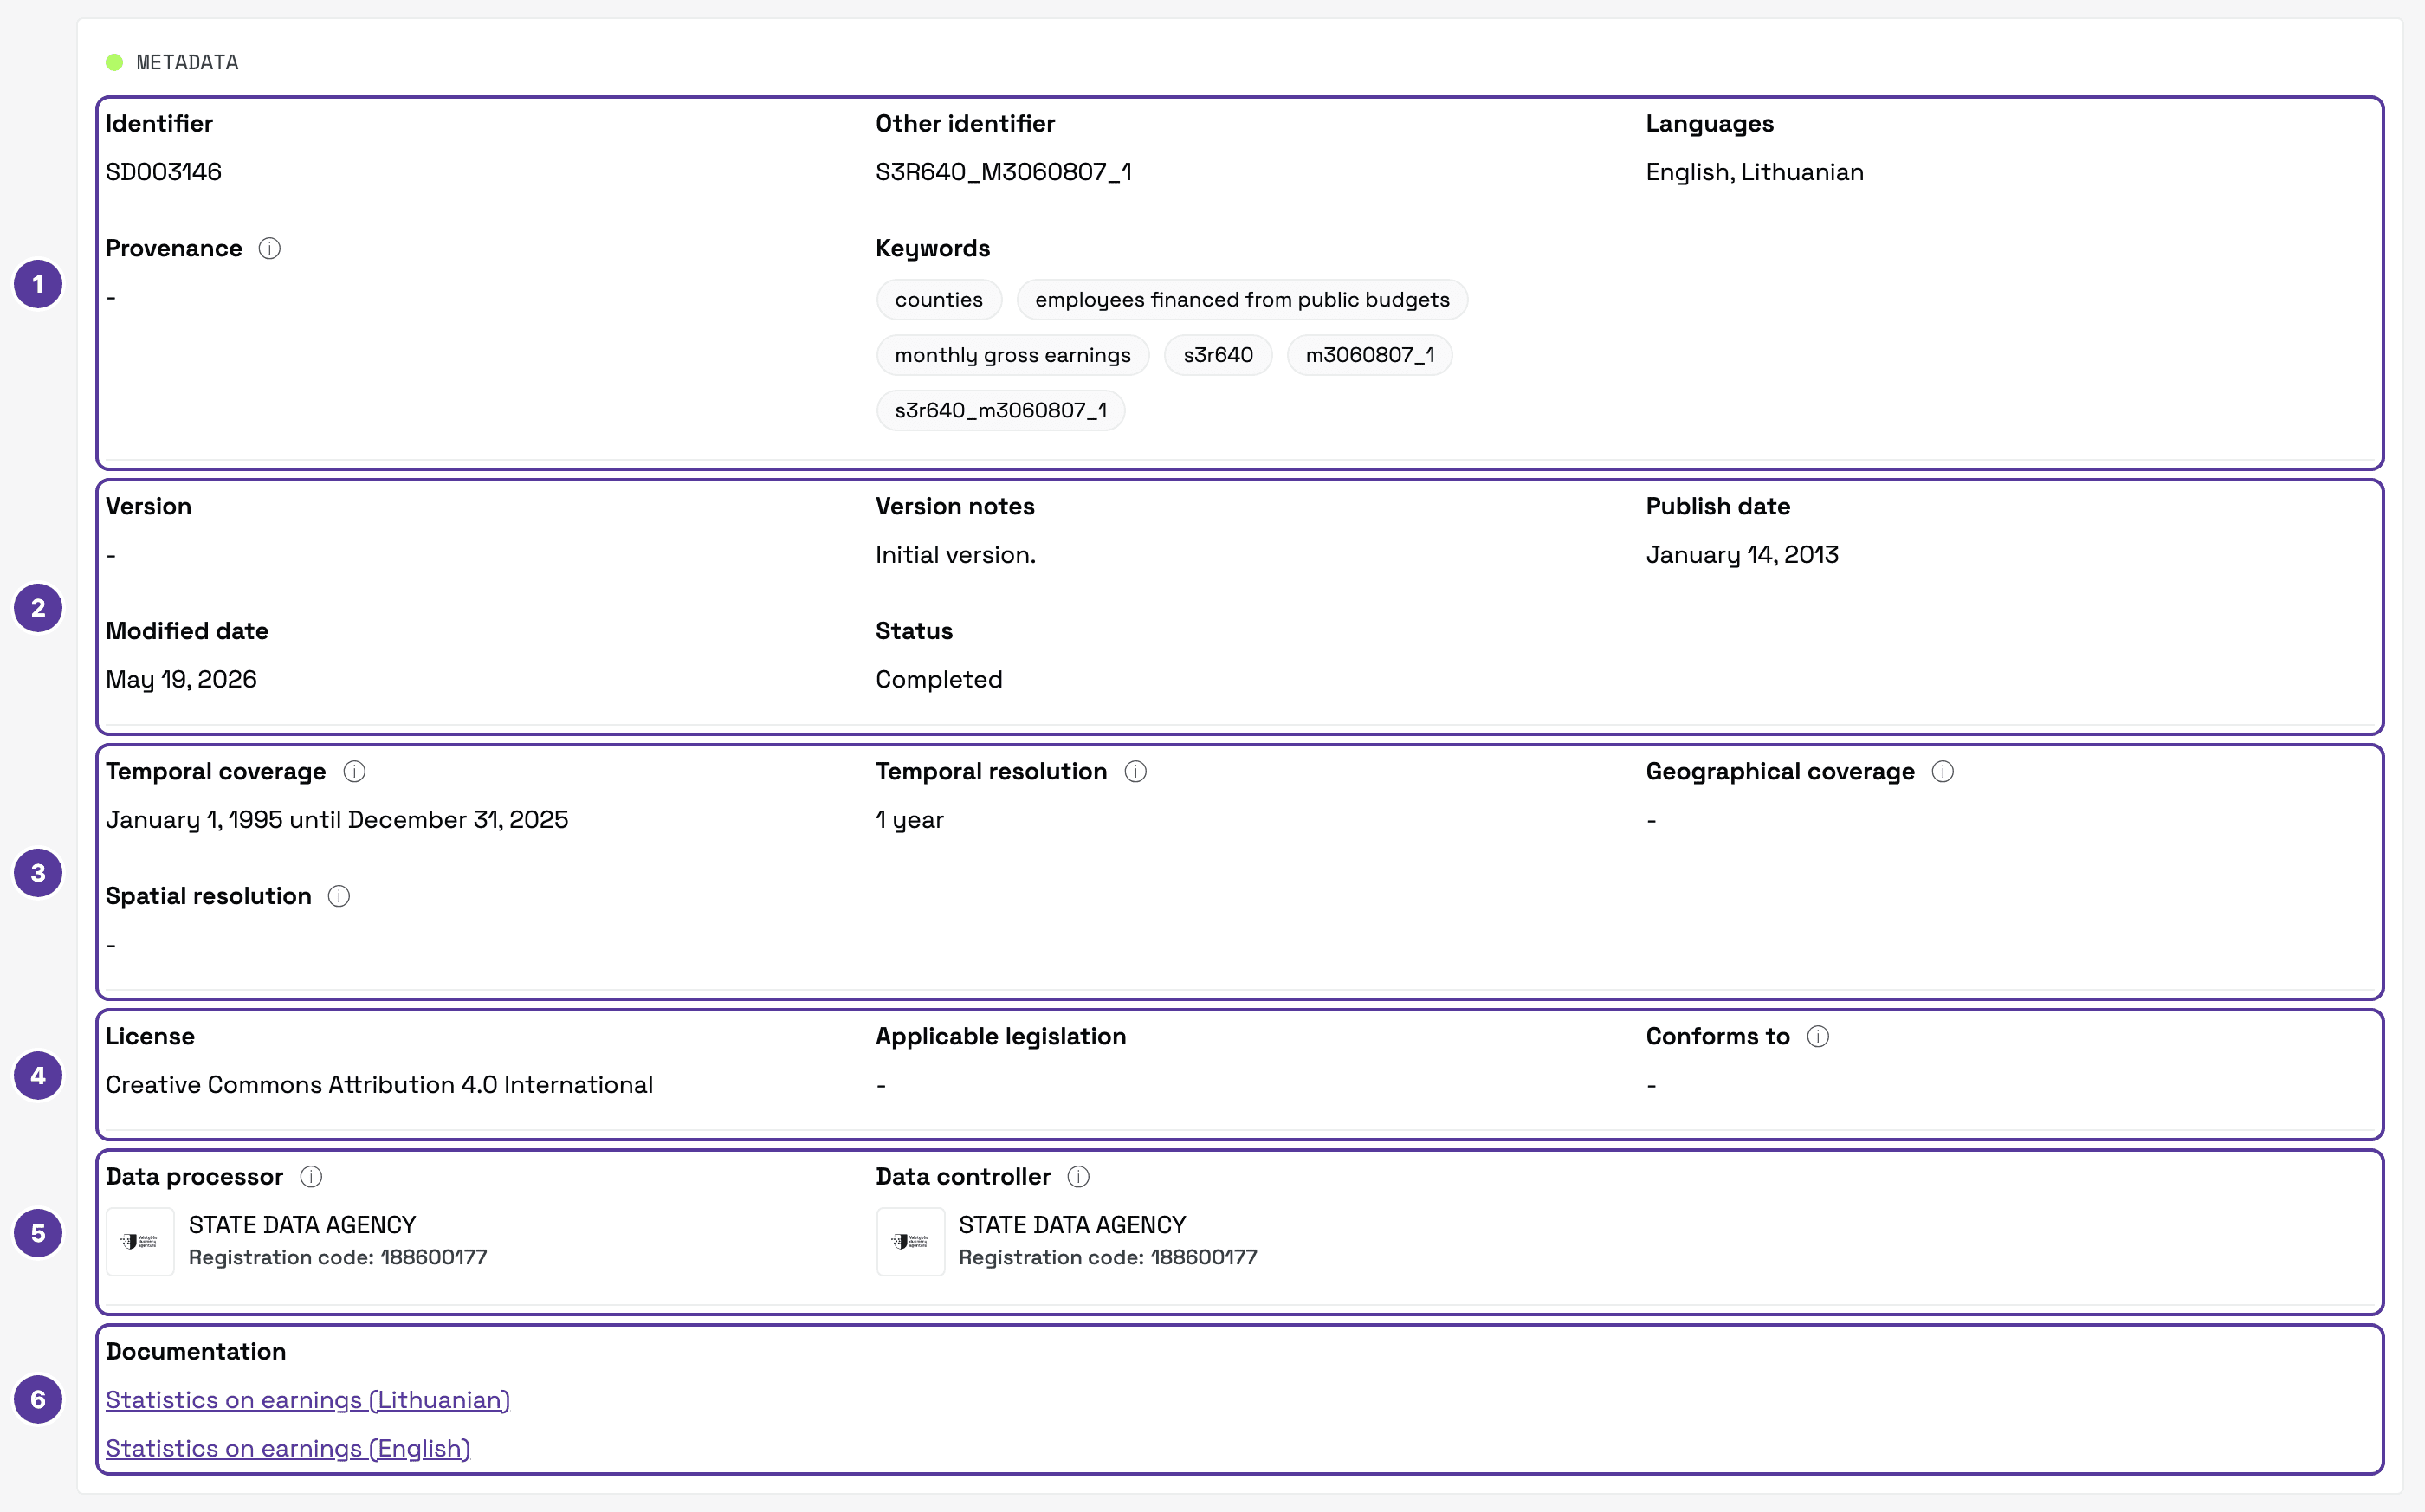
- Identification — Identifier (for example,
SD003146— the same code is in the dataset's address), Other identifier, Languages, Provenance (additional information about the dataset's history) and Keywords. - Version and dates — Version, Version notes, Publish date, Modified date and Status.
- Coverage — Temporal coverage (the period the dataset covers, for example 1995–2025), Temporal resolution (the smallest interval between observations: “1 year” means annual data), Geographical coverage and Spatial resolution (the smallest distance between objects in metres — for geospatial data).
- Terms of use — License, Applicable legislation and Conforms to.
- Responsible bodies — the Data controller decides the purposes and means of processing the data; the Data processor processes it under the controller's rules.
- Documentation — links to methodology descriptions (PDF), for example “Statistics on earnings” in Lithuanian and English. They explain how the data is collected and calculated.
Can I use the data freely?
It says so in the License row. For example, Creative Commons Attribution 4.0 International (CC BY 4.0) means the data can be used freely as long as you credit the source — which is what the Cite button is for.
Data Update
A timeline of the dataset's updates: scheduled ones at the top, past ones below.
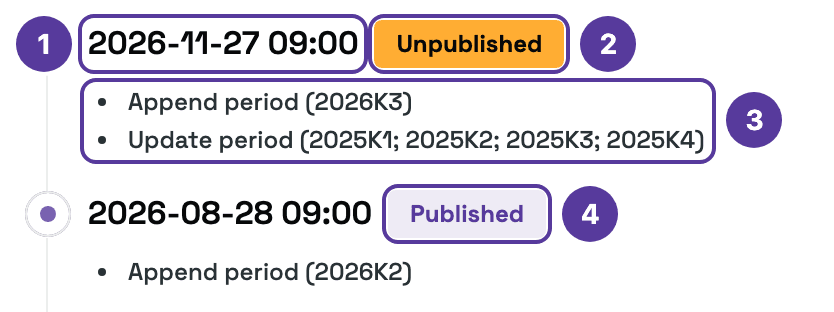
- Date and time — when the update was or will be published (usually 09:00).
- Unpublished — a scheduled update. The same entries appear in the calendar.
- What the update covers. Append period — data for a new period is added. Update period — data already published is revised. One entry can do both: here it adds Q3 2026 and revises all four quarters of 2025.
- Published — an update that has happened.
Periods are written like this:
| Notation | Means |
|---|---|
2025 | A year |
2026K3 | Q3 2026 (K — ketvirtis, quarter) |
2026M09 | September 2026 (M — month) |
Tips & tricks
- When is the next release? Entries run from latest to earliest, so the next update is the lowest entry marked Unpublished — the one just above the first Published.
- Figures changed? An entry with an Update period means earlier data was revised — normal in statistics as fuller information comes in.
Sources, Related datasets, Data reuses
-
Sources — where the data came from.
-
Related datasets — other related datasets.
-
Data reuses — where this dataset has already been used.
These tabs are often empty
For now, on most datasets these three tabs show “No data found” — it means the information has not been provided yet, not that something is wrong.
To work with the table itself, see The data table.
How is this guide?