# User guide (https://guides.dataportal.gov.lt/docs/guide)
The Lithuanian Data Portal brings state and public-sector data together in one place. This guide helps you find your way around — to locate the information you need and put it to use.
What you'll find on the portal:
* **Official statistics** — indicators produced to international standards, from population to the economy.
* **Open data** — freely reusable datasets from many institutions.
* **Geospatial data** — location-based data shown on a map.
* **Classifications** — standardised lists of codes and values (such as NACE).
* **Use cases** — dashboards, publications and examples of how the data is applied.
* **Historical data** — not only the latest figures, but data from the interwar and Soviet periods.
Data is organised by theme, and a single question to the [smart search](https://guides.dataportal.gov.lt/docs/guide/smart-search) is often enough to reach the dataset you need.
## Where to start [#where-to-start]
# About the portal (https://guides.dataportal.gov.lt/docs/guide/about-portal)
The Lithuanian Data Portal brings state and public-sector data together in one place — official statistics, open and geospatial data, and the ways they are put to use. It is run by the State Data Agency (Valstybės duomenų agentūra, VDA), the institution responsible for official statistics and state data governance. Rather than searching separate registers and websites, the data is reachable together here, with shared search and browsing.
## The idea [#the-idea]
* **A single gateway to state data.** Data from different institutions is presented on one platform — from collection through to use.
* **Common standards and interoperability.** Data is described with unified metadata and classifications, so it can be compared, linked and processed automatically.
* **Built for machine use.** Structured data, open formats (CSV, JSON, Parquet) and an API let it feed into analysis and AI solutions without extra preparation.
* **Open data for society.** Freely available data serves business, researchers, the public sector and anyone who finds it useful.
* **Data-driven decisions.** Reliable, up-to-date information supports decision-making and informs the public.
## Who it is for [#who-it-is-for]
The portal is for everyone who needs state data — residents, businesses, researchers and public-sector institutions.
# Smart search (https://guides.dataportal.gov.lt/docs/guide/smart-search)
The portal search understands plain language: you can type a whole question, not just a keyword. For example, **“vidutinis darbo užmokestis pagal apskritis”** (average wage by county) brings the wage-by-county dataset to the top. It searches the whole portal — datasets, statistics, classifications, use cases and organisations.
## How to search [#how-to-search]
### Open search [#open-search]
There are two ways to open search:
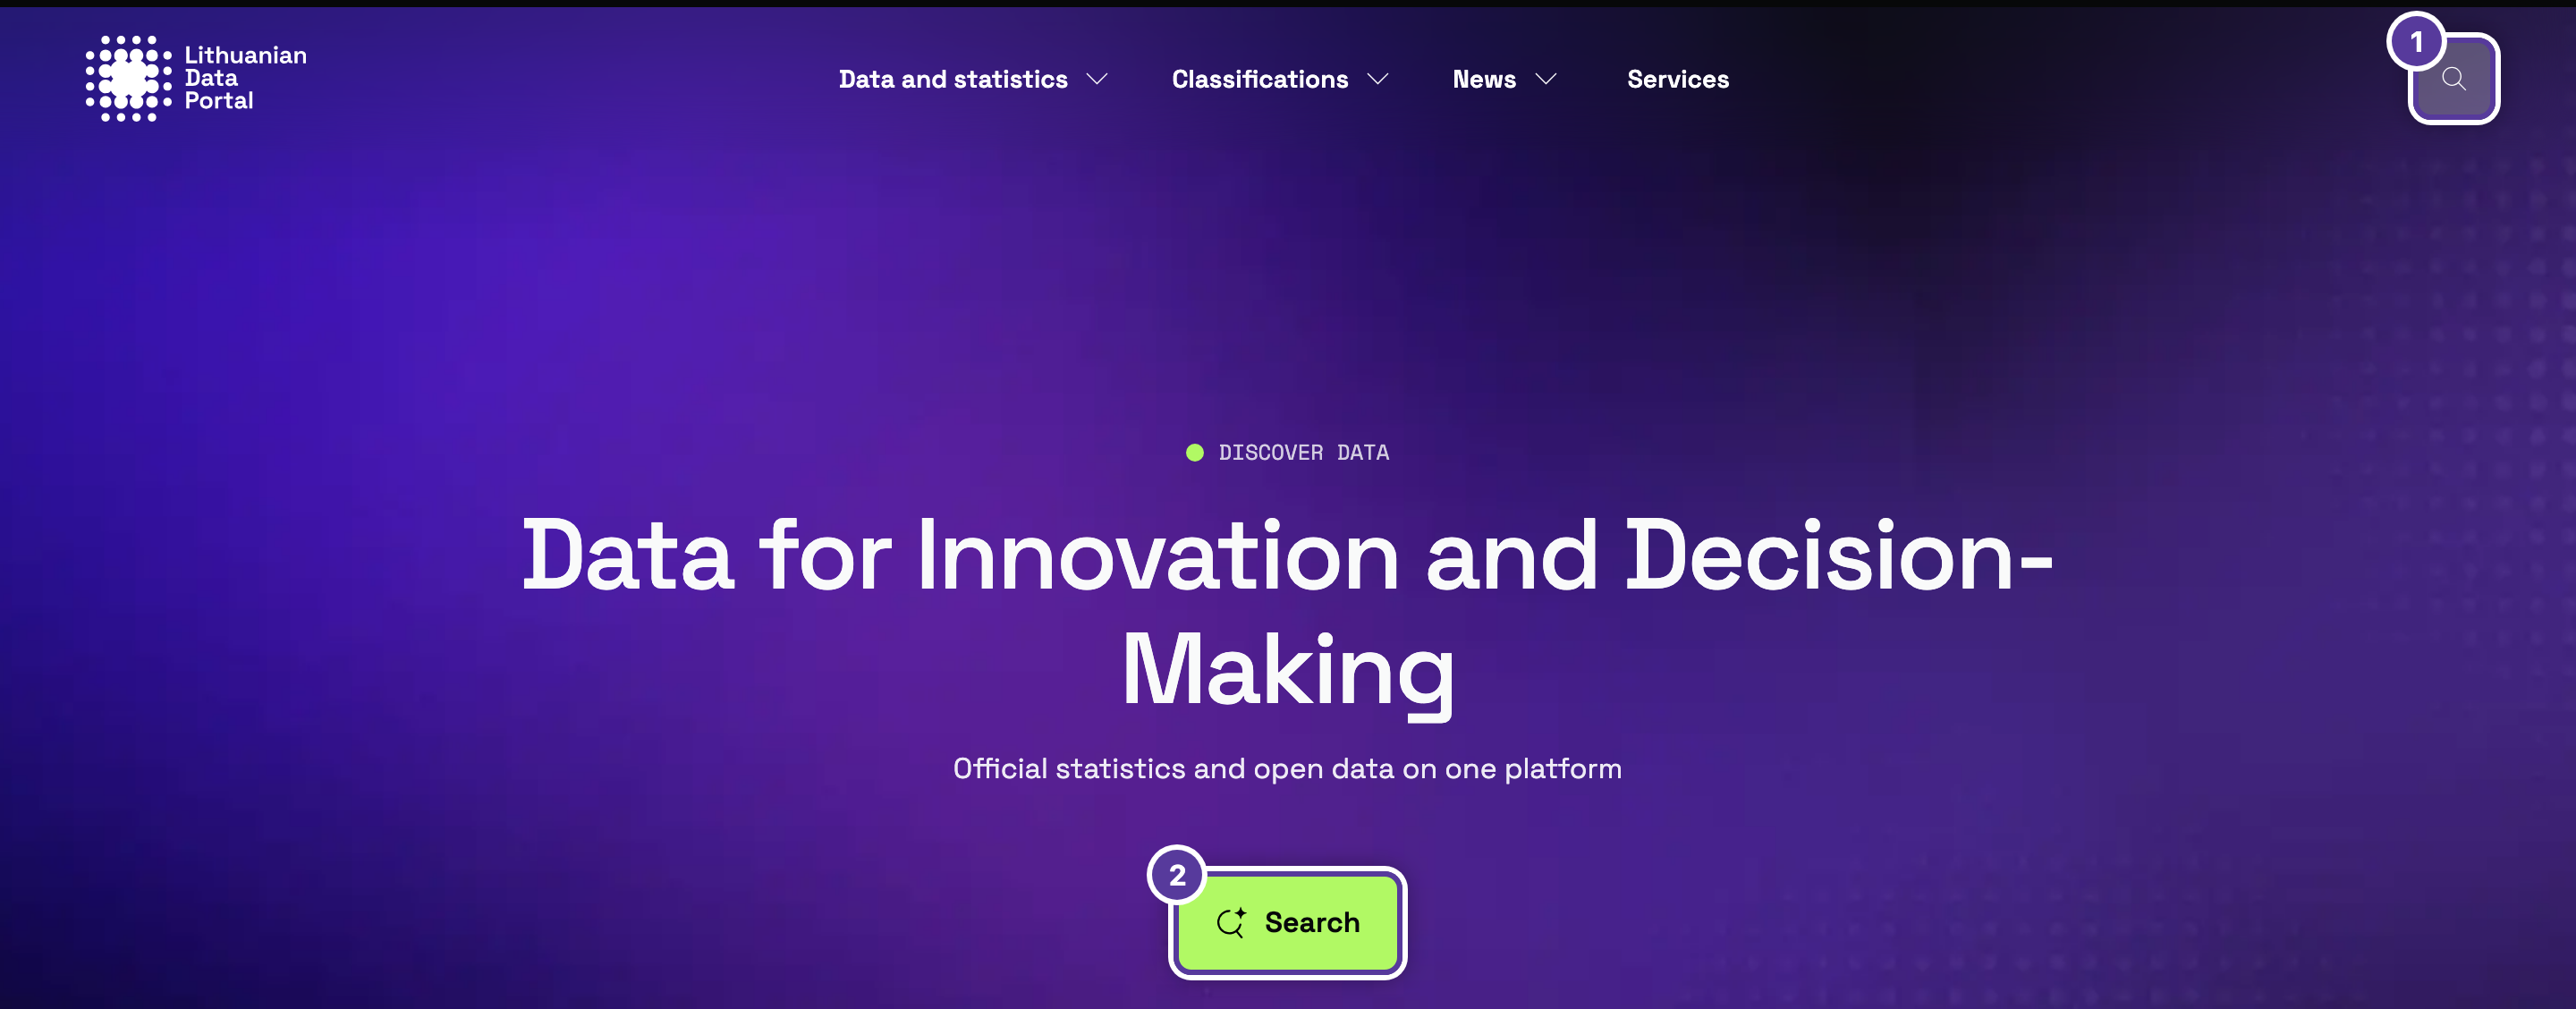
1. **The search icon** in the portal header — available from any page.
2. The **Search** button on the homepage.
### Type your question [#type-your-question]
Write in plain language — a word, a phrase or a whole question. You don't need to know the exact dataset name. Press **Search** or **Enter**.

Datasets are named and described in Lithuanian, so a Lithuanian query matches far more of them. “Average salary by county” finds nothing, while “vidutinis darbo užmokestis pagal apskritis” finds dozens of results. The dataset pages themselves are available in English.
The query goes into the browser address, so you can copy the link to the results and share it.
### Read the results [#read-the-results]
Results are ranked by relevance — the best matches come first — and the line above the list says how many were found. Every result is laid out the same way:

1. **Content type** — for example, *Statistics* (an official statistics indicator) or *Data* (a dataset).
2. **Source, status and frequency.** On the English portal these tags stay in Lithuanian: *Oficialioji statistika* (official statistics), *Parengtas* (completed), *Kasmetinis* (annual). *Nebeatnaujinamas* means no new data will be added.
3. **Title** — first the indicator, then the breakdown after “|”. This dataset is broken down by county ( *Apskritys*). Titles in the results list are in Lithuanian.
4. **Publication and update dates**, and the **data provider**.
5. **Download formats.** “+1” means one more format (JSON, for this dataset).
### Filter by content type [#filter-by-content-type]
Above the results, click one or more content-type filters. They combine — tick **Statistics** and **Classifiers** to see both — and **All** clears them.
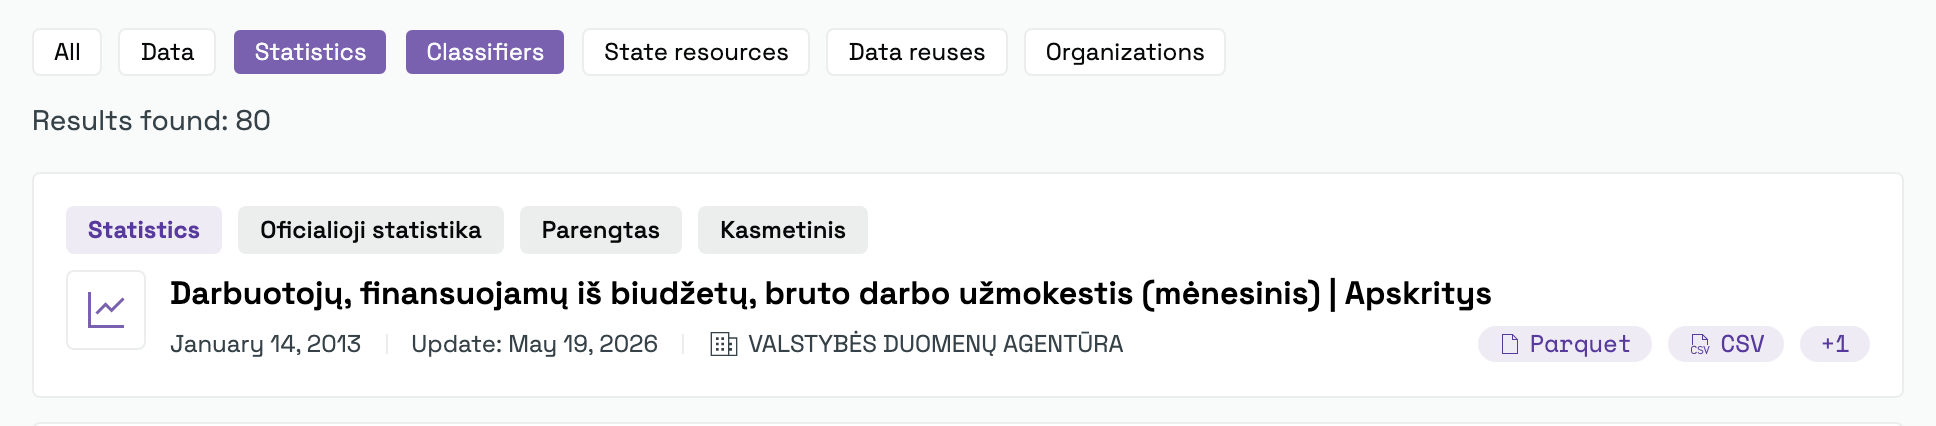
What each filter holds is in the [table below](#what-search-covers).
### Open the dataset [#open-the-dataset]
Click a result to open its [dataset page](https://guides.dataportal.gov.lt/docs/guide/browsing-data/dataset-page), with the description, the data table and downloads — in English.
## What search covers [#what-search-covers]
| Filter | What it shows |
| ------------------- | ----------------------------------- |
| **All** | All results together. |
| **Data** | Datasets. |
| **Statistics** | Official statistics indicators. |
| **Classifiers** | Classifications and vocabularies. |
| **State resources** | State information resources. |
| **Data reuses** | Examples of how data has been used. |
| **Organizations** | Data providers. |
## If nothing is found [#if-nothing-is-found]
The portal shows **“No results found”**. Then:
* **Check the filters.** The ticked content type may have no matches — click **All**.
* **Try Lithuanian.** An English query often finds nothing where the Lithuanian one does — see the note above.
* **Search more broadly.** Keep the key words, for example “darbo užmokestis” instead of a long question.
- **Be specific.** Adding a breakdown (for example, “pagal apskritis” — by county, or “ketvirčiais” — quarterly) gives sharper results.
- **Looking for a specific dataset?** Use the [catalogue filters](https://guides.dataportal.gov.lt/docs/guide/browsing-data), where you can pin down by theme, type or status.
# Catalogue and filters (https://guides.dataportal.gov.lt/docs/guide/browsing-data)
The data catalogue holds every dataset on the portal. There are three ways to reach the one you need — browse by theme, search the catalogue, or filter it — and combining them is usually fastest. To ask a question in plain language and search the whole portal, use [smart search](https://guides.dataportal.gov.lt/docs/guide/smart-search).
## Browsing by theme [#browsing-by-theme]
In the **Data and statistics** menu, open **Themes**:
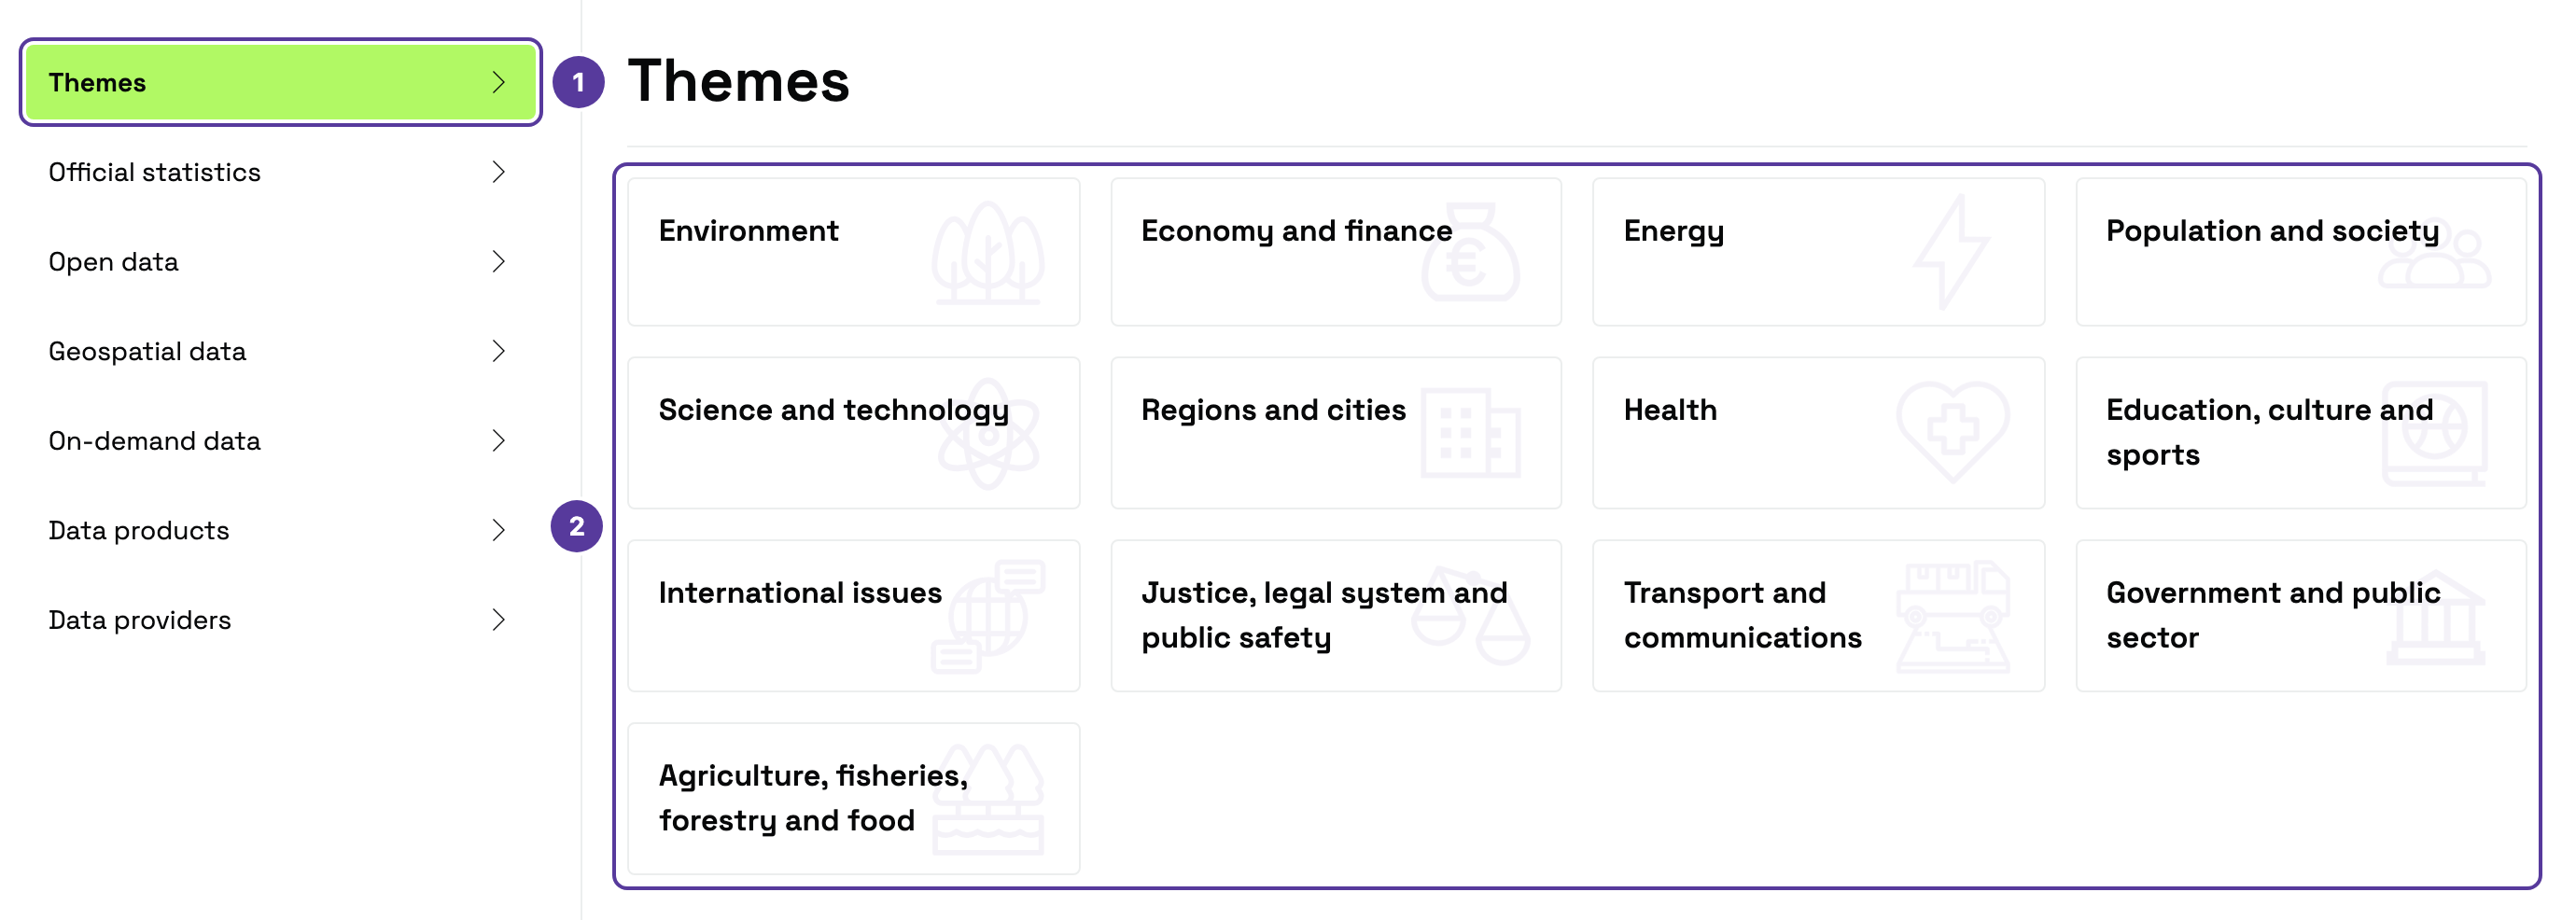
1. **Themes** — the first menu item. The items below it lead to other groups of data, such as *Official statistics* or *Open data*.
2. **13 themes** — from *Environment* to *Agriculture, fisheries, forestry and food*. Click a theme to open the catalogue limited to that area.
## Search and results [#search-and-results]
Above the list of datasets are the search, the active filters, the result count and sorting:
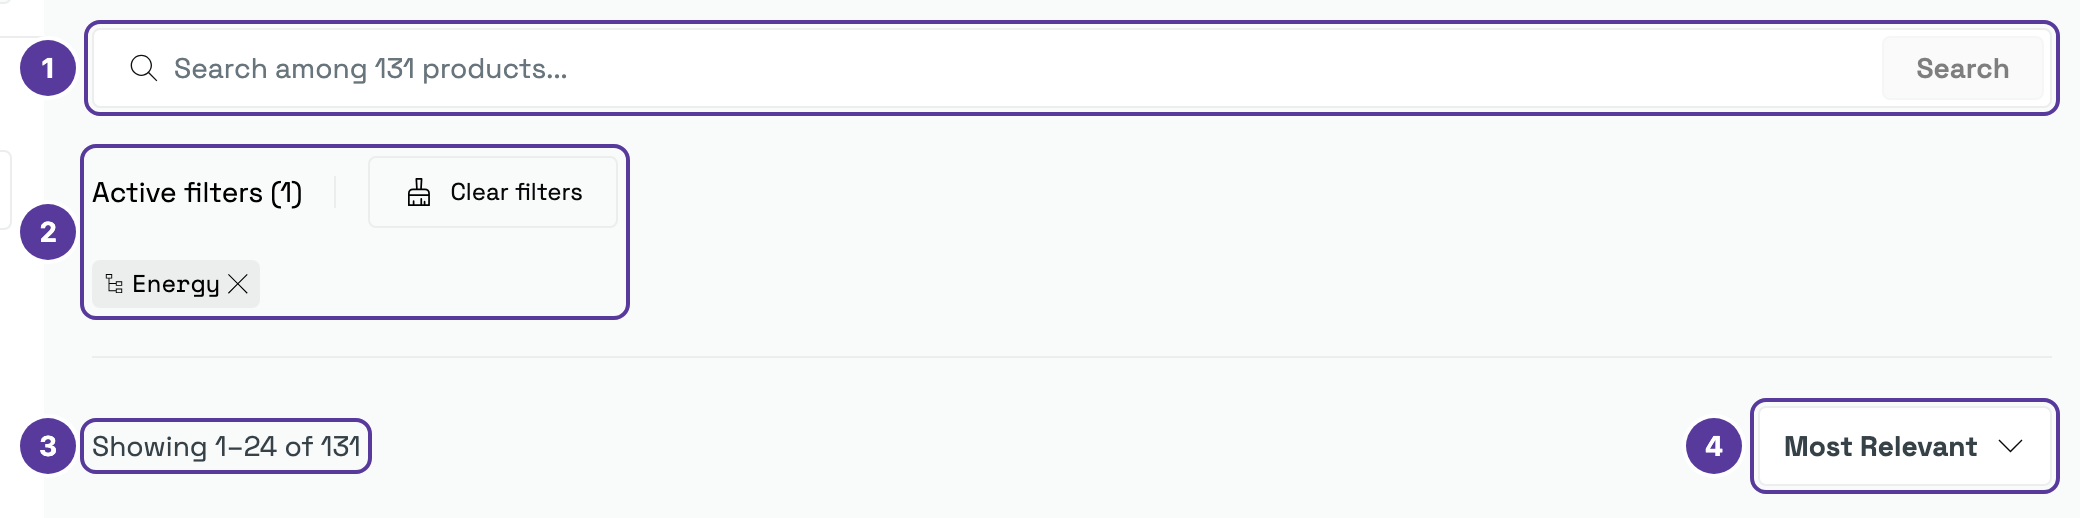
1. **Catalogue search** — searches datasets only, together with the filters you have ticked. The placeholder says how many datasets it will search.
2. **Active filters** — each ticked filter shows as a tag. **×** removes one; **Clear filters** removes them all.
3. **Result count** — how many datasets match the search and filters (for example, “Showing 1–24 of 131”).
4. **Sorting** — *Most Relevant*, *Newest*, *Oldest*, *Title A-z* or *Title Z-a*.
## Filters [#filters]
The catalogue has a filter panel on the left with six groups. In the image they are numbered in the same order as on the portal and below:
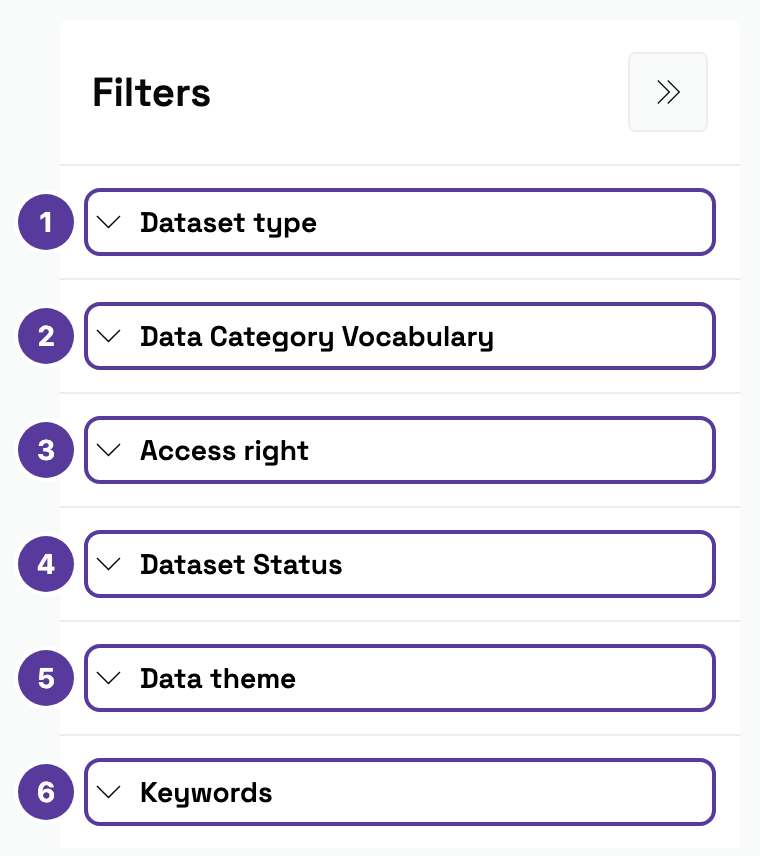
The technical nature of the dataset — close to thirty types in all. The ones that matter day to day:
* **Tabular data**, **Statistical data** and **Geospatial data** — the data itself.
* **High-value dataset** — data the EU has singled out as especially useful.
* **National classification**, **International classification**, **Code list**, **Taxonomy**, **Thesaurus** — [classifications](https://guides.dataportal.gov.lt/docs/guide/classifiers) and vocabularies.
The rest (schemas, ontologies, application profiles and so on) are for metadata specialists. The group has its own search box.
**Official statistics**, **Open data** or **Experimental statistics**.
Who may use the data: **Public**, **Non-public**, **Confidential**, **Sensitive**, **Restricted**, **Provisional data**. For freely usable data, choose **Public**.
The state of the dataset: **Completed**, **Under development**, **Integrated**, **Inventoried**, **Provisional data**, **Discontinued**, **Deprecated**, **Withdrawn**. For current data, choose **Completed**.
The same 13 areas as in the menu. You can tick several.
Keywords assigned to datasets, with their own search box — handy when you already know the exact keyword.
Filters from different groups combine: ticking the **Energy** theme and the **Official statistics** category returns only datasets matching both. Your choices — and your search — are stored in the address, so a filtered view can be bookmarked or sent to a colleague.
When you tick the **Official statistics** category, the portal also ticks the **Completed** status — you will see it under **Active filters**. If you want discontinued datasets too, remove that tag.
## The dataset card [#the-dataset-card]
Each result in the catalogue is a card with the key facts:
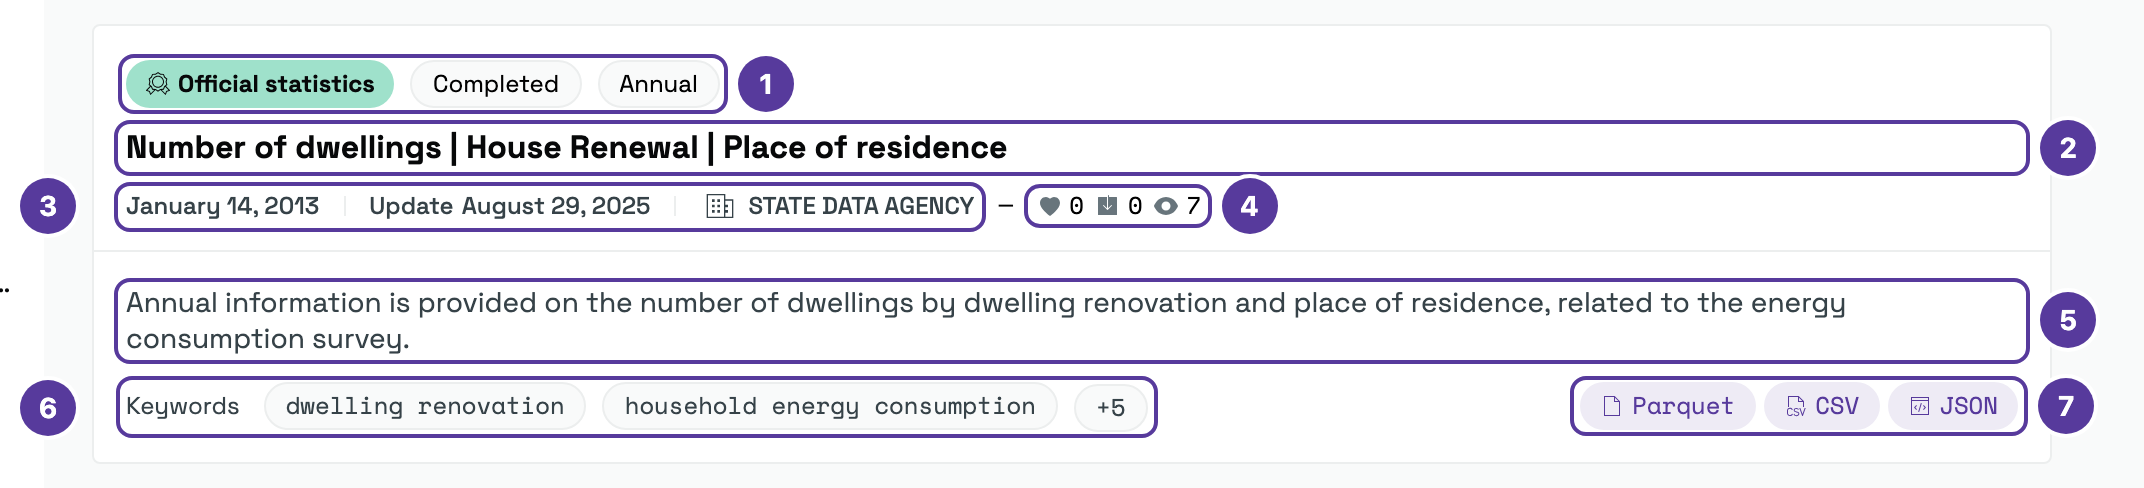
1. **Category, status and update frequency** — for example, *Official statistics*, *Completed*, *Annual*.
2. **Title** — first the indicator, then the breakdowns after “|”.
3. **Publication and update dates**, and the **publisher**.
4. **Likes, downloads and views.**
5. **A short description.**
6. **Keywords** — “+5” means five more.
7. **Download formats.**
Found a good one? Click its title to open the [dataset page](https://guides.dataportal.gov.lt/docs/guide/browsing-data/dataset-page).
* **Combine search with filters.** Tick a theme and a category, then type a word — the search runs only over the datasets you narrowed down to.
* **Looking for the latest data?** Sort by **Newest**.
* **Not sure where to start?** Ask [smart search](https://guides.dataportal.gov.lt/docs/guide/smart-search) a question — it searches the whole portal, not just the catalogue.
# The dataset page (https://guides.dataportal.gov.lt/docs/guide/browsing-data/dataset-page)
When you open a dataset, its title sits at the top, and around it is the information you need to decide whether the data suits you.
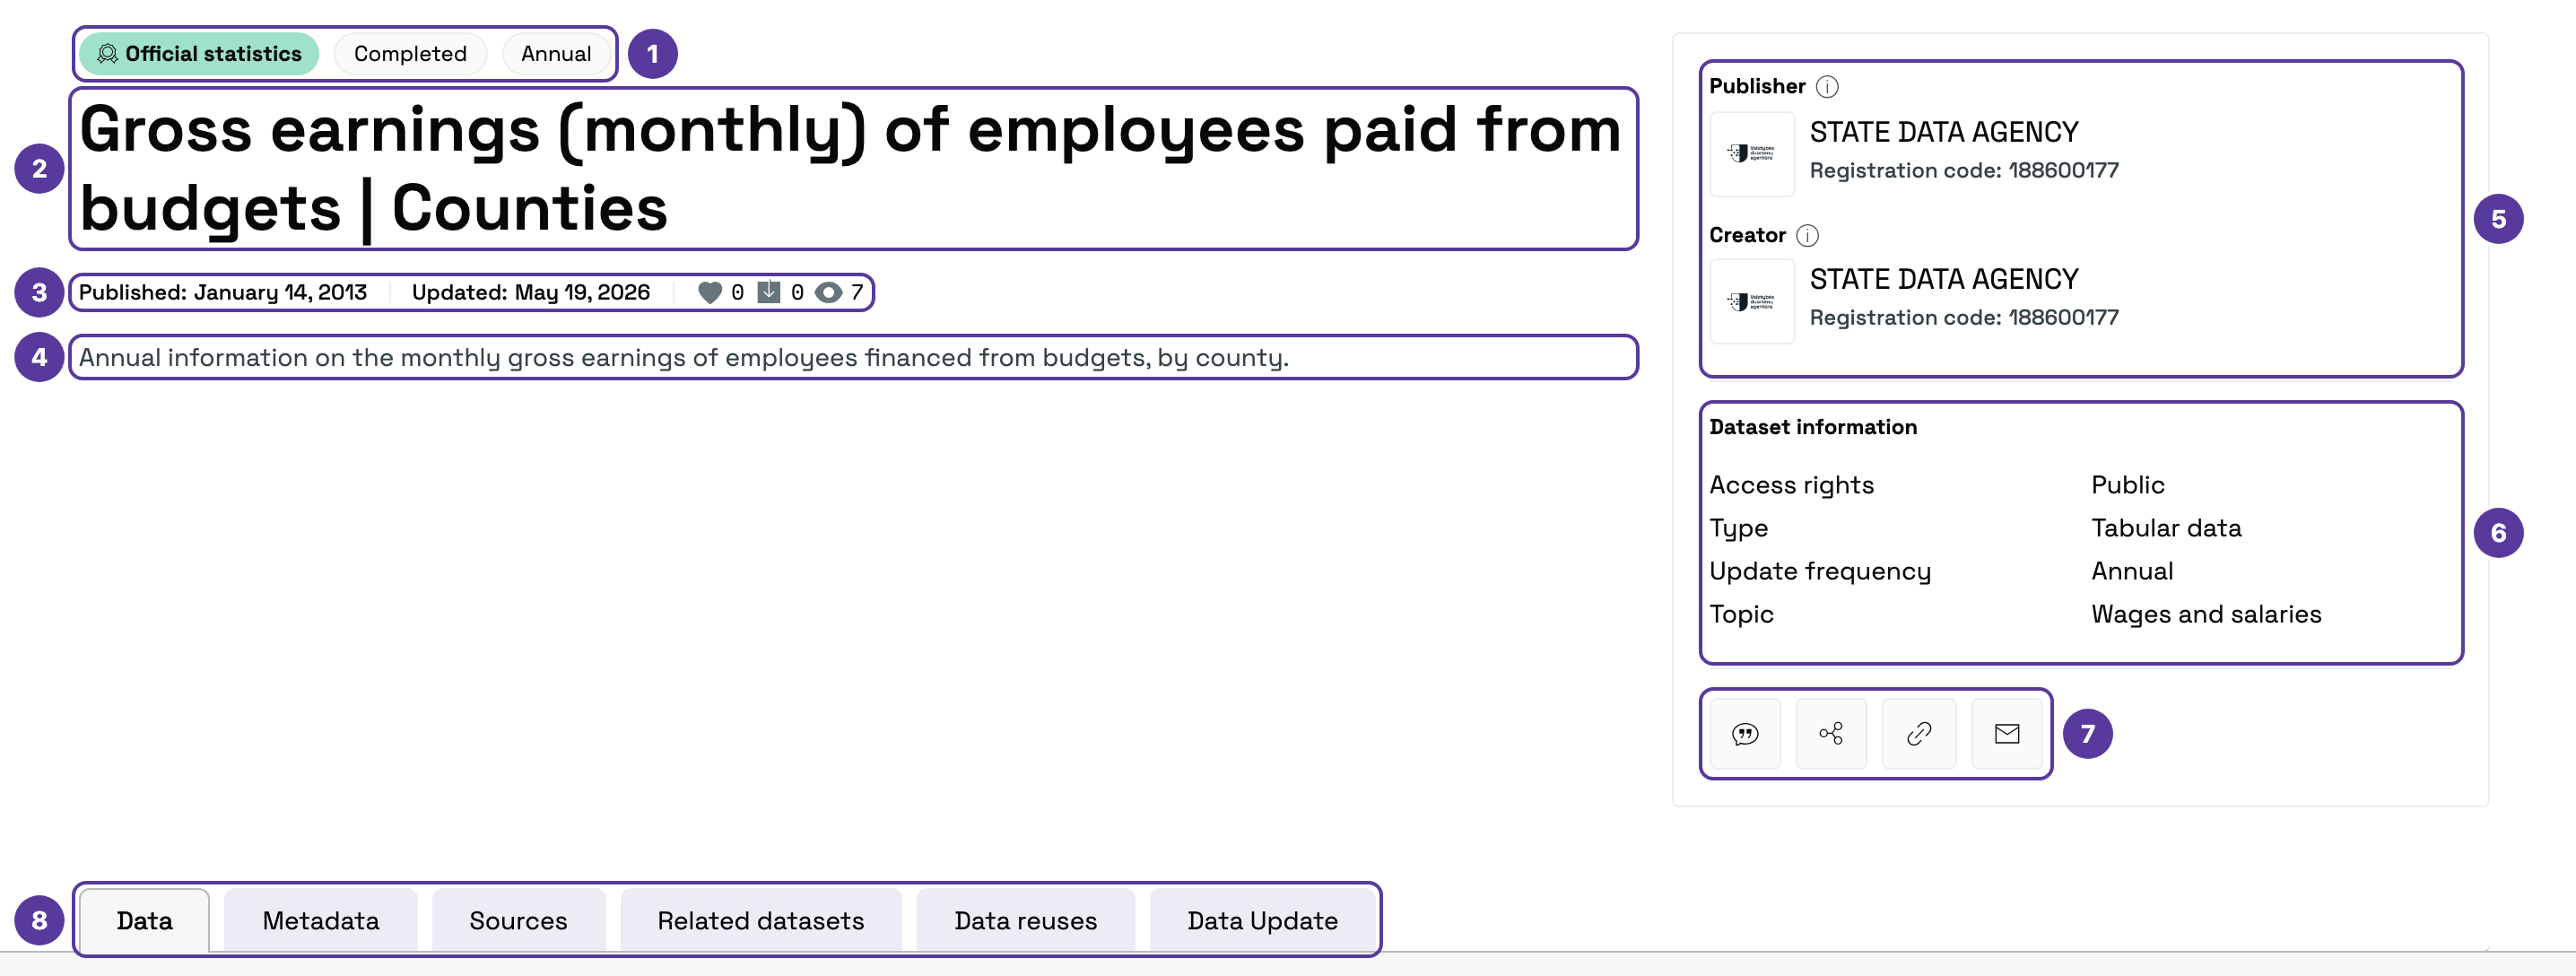
1. **Category, status and update frequency** — the same tags as in the [catalogue](https://guides.dataportal.gov.lt/docs/guide/browsing-data).
2. **Title** — first the indicator, then the breakdowns after “|”.
3. **Publication and update dates**, and the number of **likes, downloads and views**. The update date matters more — it shows when the data last changed.
4. **Description** — what the dataset covers.
5. **Publisher** — the institution that published the dataset on the portal — and **Creator** — the institution that produced the data. Often they are the same.
6. **Dataset information** — access rights, type, update frequency and topic.
7. **Actions** — cite, share, copy the link and send feedback. Described below.
8. **Tabs** — the data, metadata and more. Described below.
## Cite, share, give feedback [#cite-share-give-feedback]
Below the dataset information are four buttons:
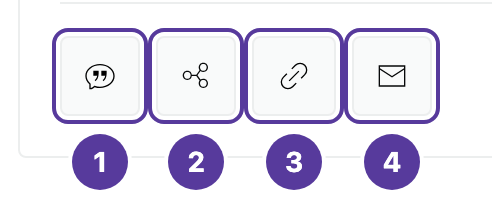
1. **Cite** — choose a format: *EU Data Citation*, *APA*, *Harvard* or *Vancouver*.
2. **Share** — via *Facebook*, *LinkedIn*, *X*, *Messenger* or email.
3. **Copy link** — copies the dataset's address.
4. **Feedback form** — leave feedback about this dataset: your full name, email and a message (up to 2,500 characters), then **Send**.
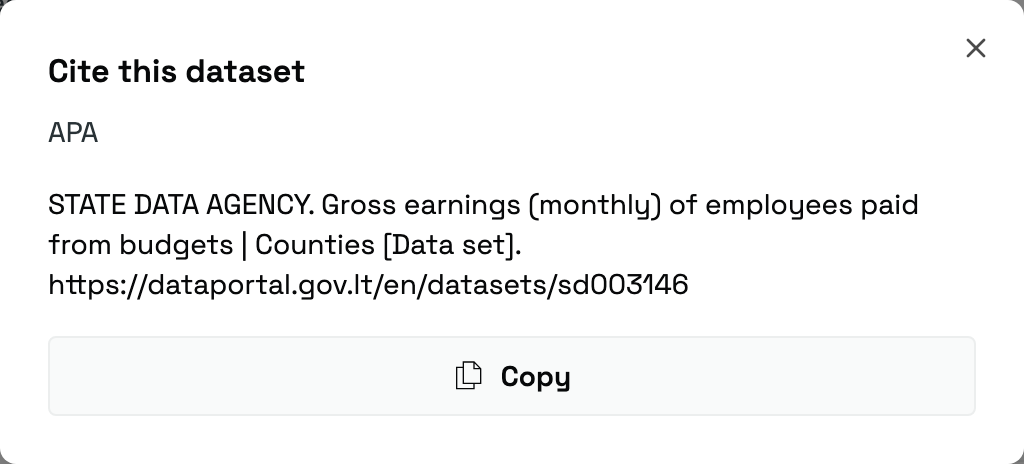
Choosing a citation format opens a window with a ready-made citation — copy it with **Copy**:
## Tabs [#tabs]
The dataset's content is split into six tabs. The first, **Data**, opens by default.
### Data [#data]
The data table itself. It is shown in the language you are browsing in — on the Lithuanian portal its name ends in “(lietuvių k.)”, on the English one in “(English)”. The table header says when it was updated and which formats it can be downloaded in.
Above the table you switch views (*Table*, *Structure*, *Distribution information*) and use **Columns** and **Filters** to choose what to show — see [The data table](https://guides.dataportal.gov.lt/docs/guide/browsing-data/table). The **Export** button downloads the data — see [Downloading](https://guides.dataportal.gov.lt/docs/guide/browsing-data/downloading).
### Metadata [#metadata]
A full description of the dataset, in six groups. Some fields have an ⓘ icon — hover over it to see what the field means.
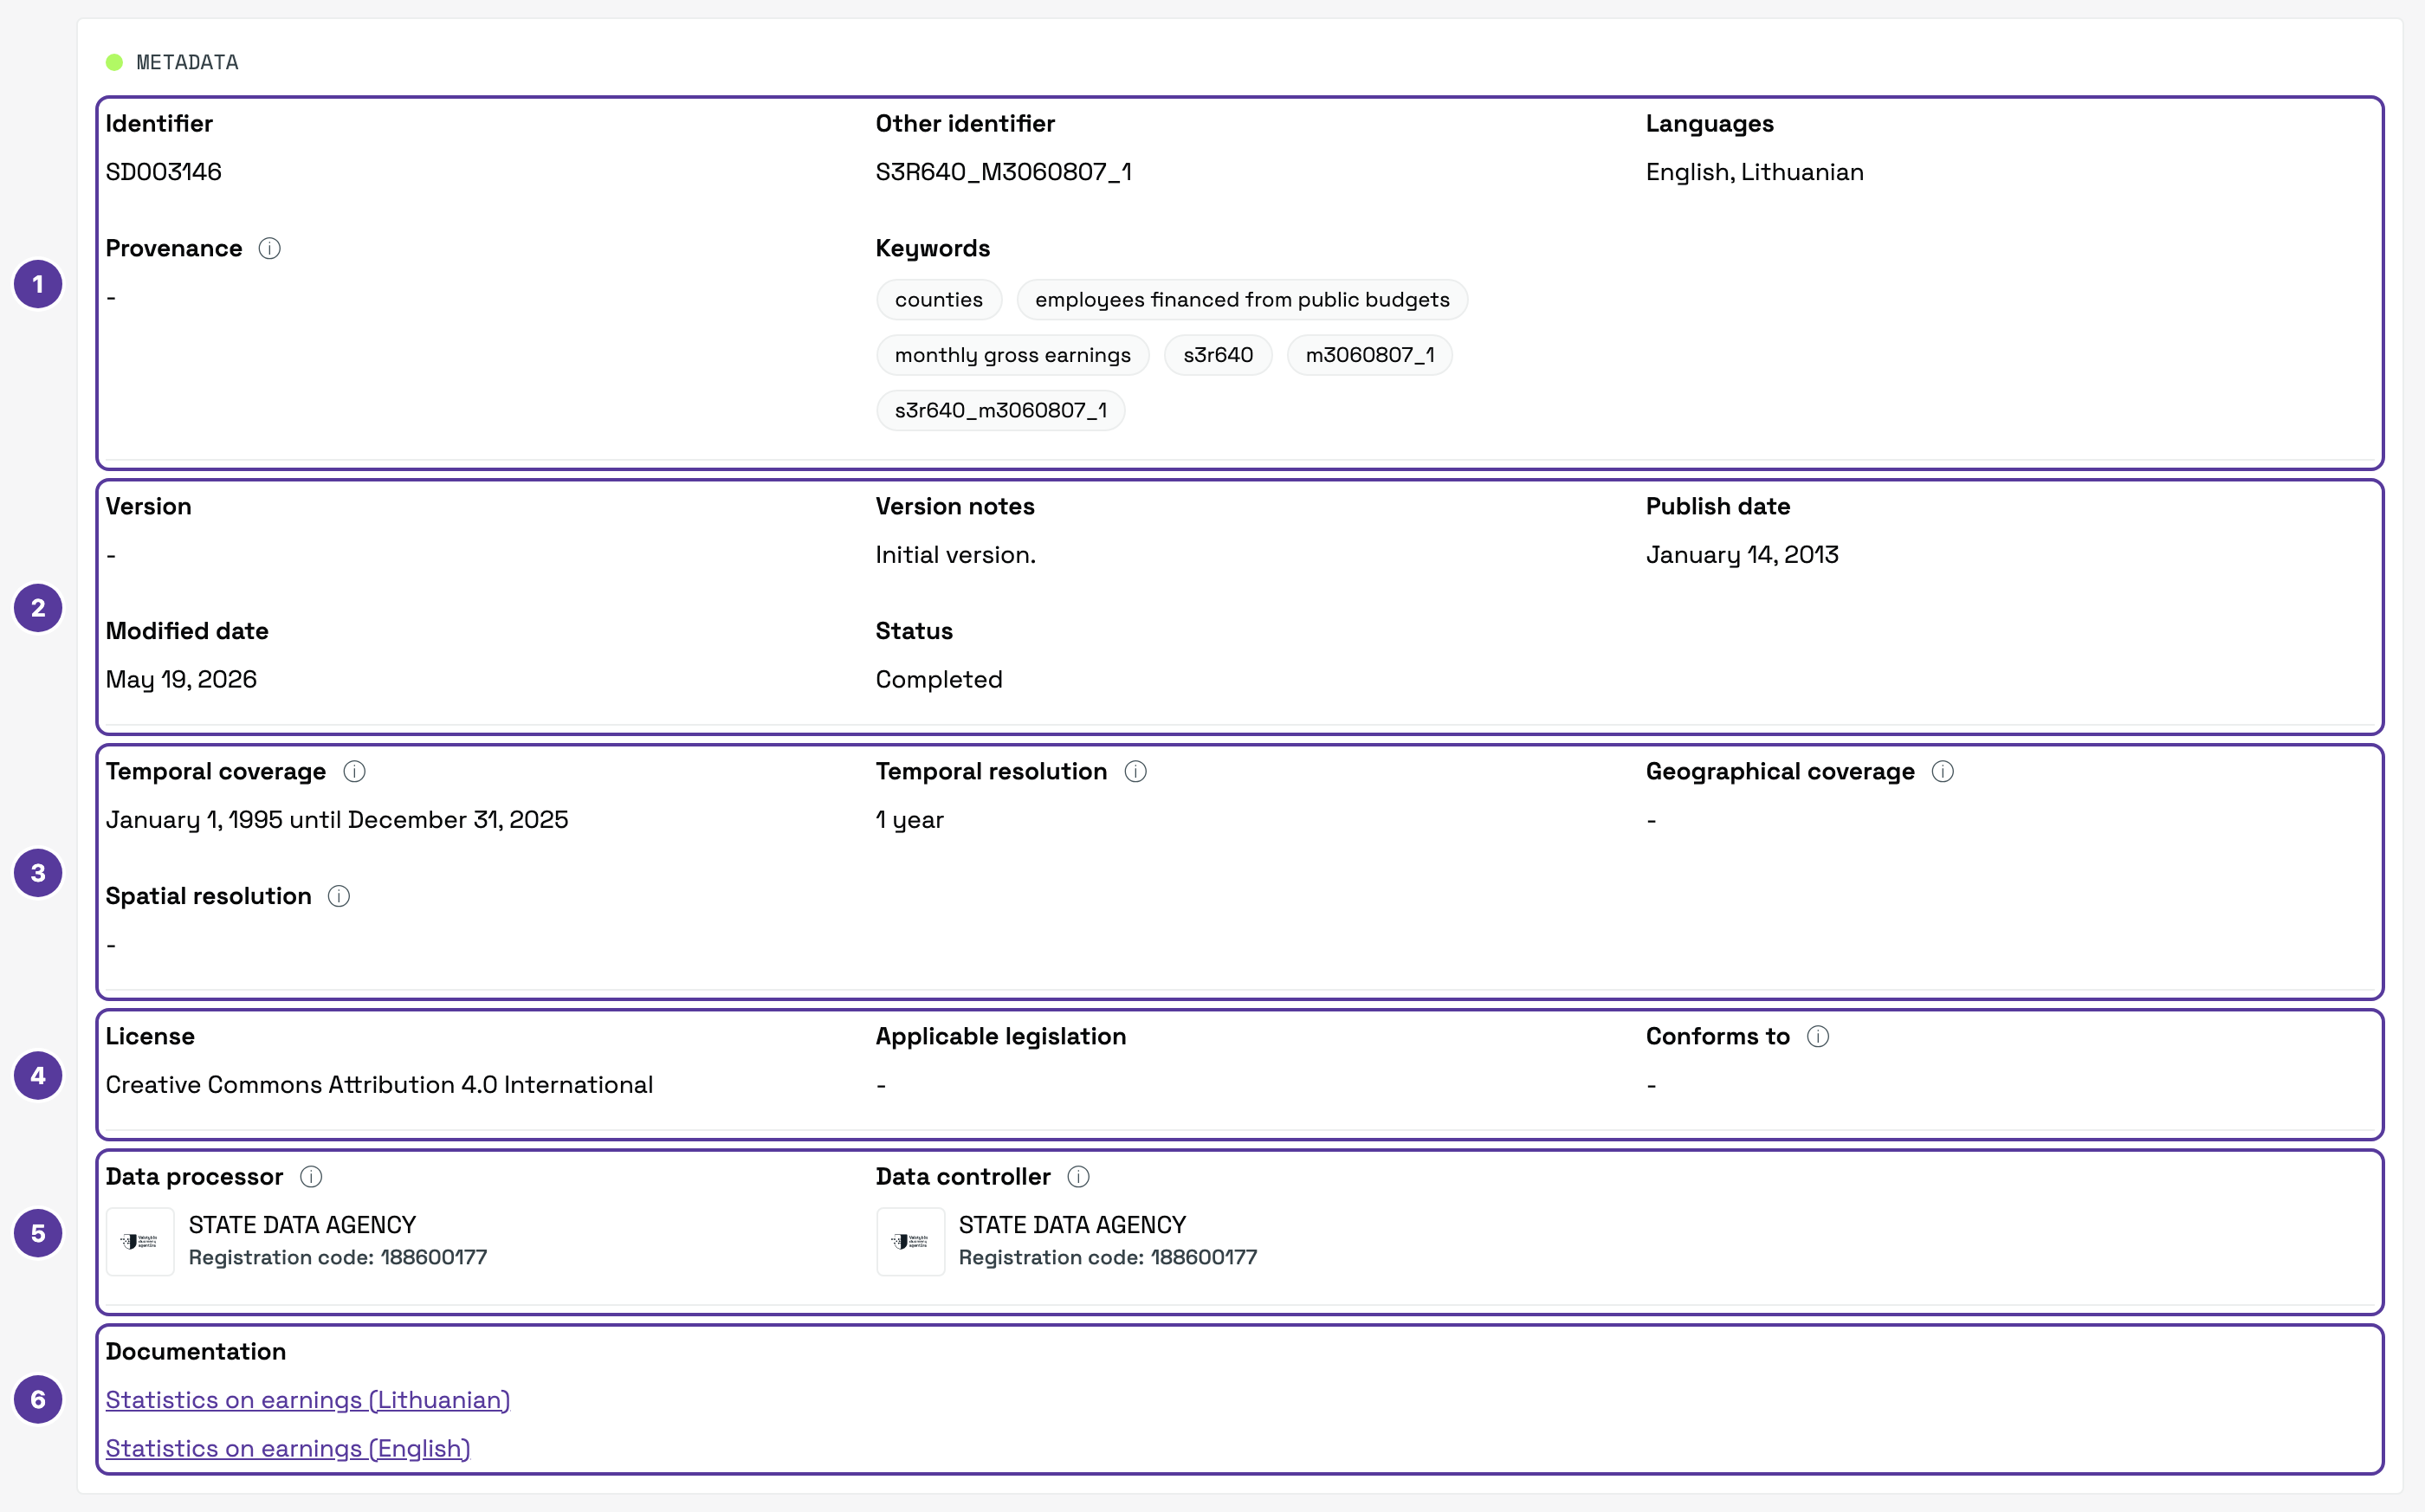
1. **Identification** — *Identifier* (for example, `SD003146` — the same code is in the dataset's address), *Other identifier*, *Languages*, *Provenance* (additional information about the dataset's history) and *Keywords*.
2. **Version and dates** — *Version*, *Version notes*, *Publish date*, *Modified date* and *Status*.
3. **Coverage** — *Temporal coverage* (the period the dataset covers, for example 1995–2025), *Temporal resolution* (the smallest interval between observations: “1 year” means annual data), *Geographical coverage* and *Spatial resolution* (the smallest distance between objects in metres — for geospatial data).
4. **Terms of use** — *License*, *Applicable legislation* and *Conforms to*.
5. **Responsible bodies** — the *Data controller* decides the purposes and means of processing the data; the *Data processor* processes it under the controller's rules.
6. **Documentation** — links to methodology descriptions (PDF), for example “Statistics on earnings” in Lithuanian and English. They explain how the data is collected and calculated.
It says so in the **License** row. For example, *Creative Commons Attribution 4.0 International* (CC BY 4.0) means the data can be used freely as long as you credit the source — which is what the **Cite** button is for.
### Data Update [#data-update]
A timeline of the dataset's updates: scheduled ones at the top, past ones below.
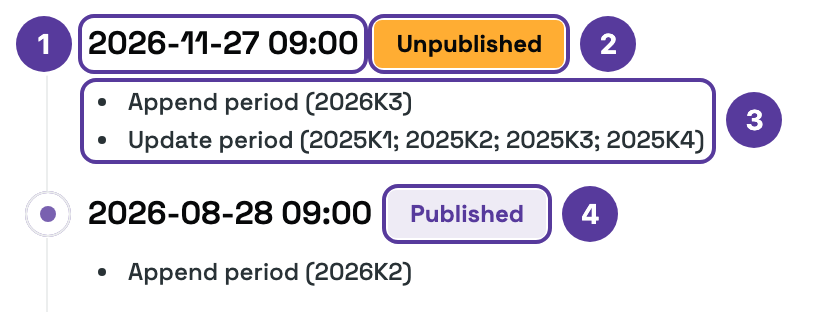
1. **Date and time** — when the update was or will be published (usually 09:00).
2. **Unpublished** — a scheduled update. The same entries appear in the [calendar](https://guides.dataportal.gov.lt/docs/guide/news/calendar).
3. **What the update covers.** *Append period* — data for a new period is added. *Update period* — data already published is revised. One entry can do both: here it adds Q3 2026 and revises all four quarters of 2025.
4. **Published** — an update that has happened.
Periods are written like this:
| Notation | Means |
| --------- | ------------------------------------ |
| `2025` | A year |
| `2026K3` | Q3 2026 (*K* — *ketvirtis*, quarter) |
| `2026M09` | September 2026 (*M* — month) |
* **When is the next release?** Entries run from latest to earliest, so the next update is the **lowest** entry marked **Unpublished** — the one just above the first **Published**.
* **Figures changed?** An entry with an *Update period* means earlier data was revised — normal in statistics as fuller information comes in.
### Sources, Related datasets, Data reuses [#sources-related-datasets-data-reuses]
* **Sources** — where the data came from.
* **Related datasets** — other related datasets.
* **Data reuses** — where this dataset has already been [used](https://guides.dataportal.gov.lt/docs/guide/use-cases).
For now, on most datasets these three tabs show “No data found” — it means the information has not been provided yet, not that something is wrong.
To work with the table itself, see [The data table](https://guides.dataportal.gov.lt/docs/guide/browsing-data/table).
# The data table (https://guides.dataportal.gov.lt/docs/guide/browsing-data/table)
On the **Data** tab a dataset is shown as a table you can explore right in the browser, without downloading a file. All of the preview controls sit above the table and in its column headers.
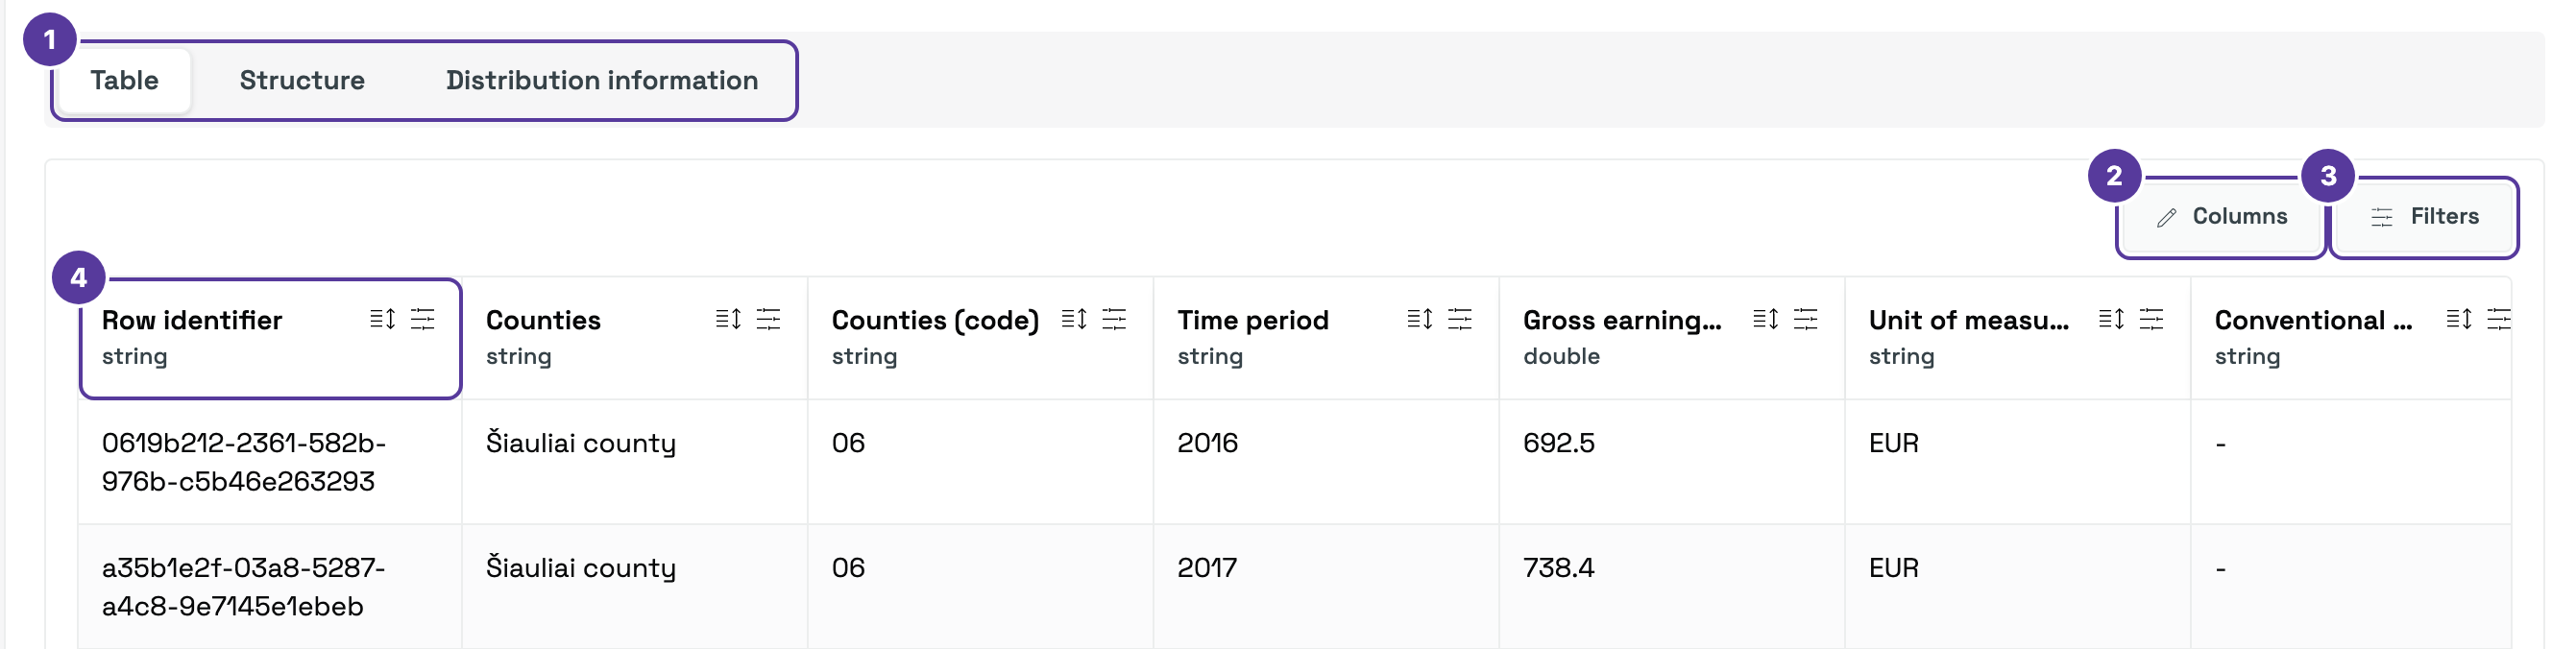
1. **Views** — three ways to display the dataset.
2. **Columns** — which columns to show.
3. **Filters** — filtering the rows.
4. A **column header** with its data type (here *Row identifier*, type `string`) and the sort and filter icons. Every column has one.
Above the views, in the table's header, are the **Export** button (see [Downloading](https://guides.dataportal.gov.lt/docs/guide/browsing-data/downloading)) and a **Collapse** arrow that hides the table.
## Views [#views]
Above the table (1) you switch between three displays:
| View | What it shows |
| ---------------------------- | ----------------------------------------------------------------------------------------------------------------------------------------------- |
| **Table** | Rows and columns — the main view. |
| **Structure** | How many rows and columns the dataset has, and each column's title, API name and type. See [Structure](#structure). |
| **Distribution information** | Technical details of this distribution: identifiers, the API link, formats, licence. See [Distribution information](#distribution-information). |
## Pages [#pages]
The table is shown a page at a time. Below it you see which rows are shown (for example, 1–24 of 390), the page numbers and a **Per page** list — **24**, **48** or **96** rows.
## Sorting [#sorting]
On the right of every column header (4) are two icons. The **sort** icon cycles through the order:
1. first click — ascending;
2. second click — descending;
3. third click — back to the original order.
The sort order, the filters and the page you are on are written into the browser's address bar, so copying the address shows someone else the same view.
## The column menu [#the-column-menu]
The **filter** icon in a header opens that column's menu:
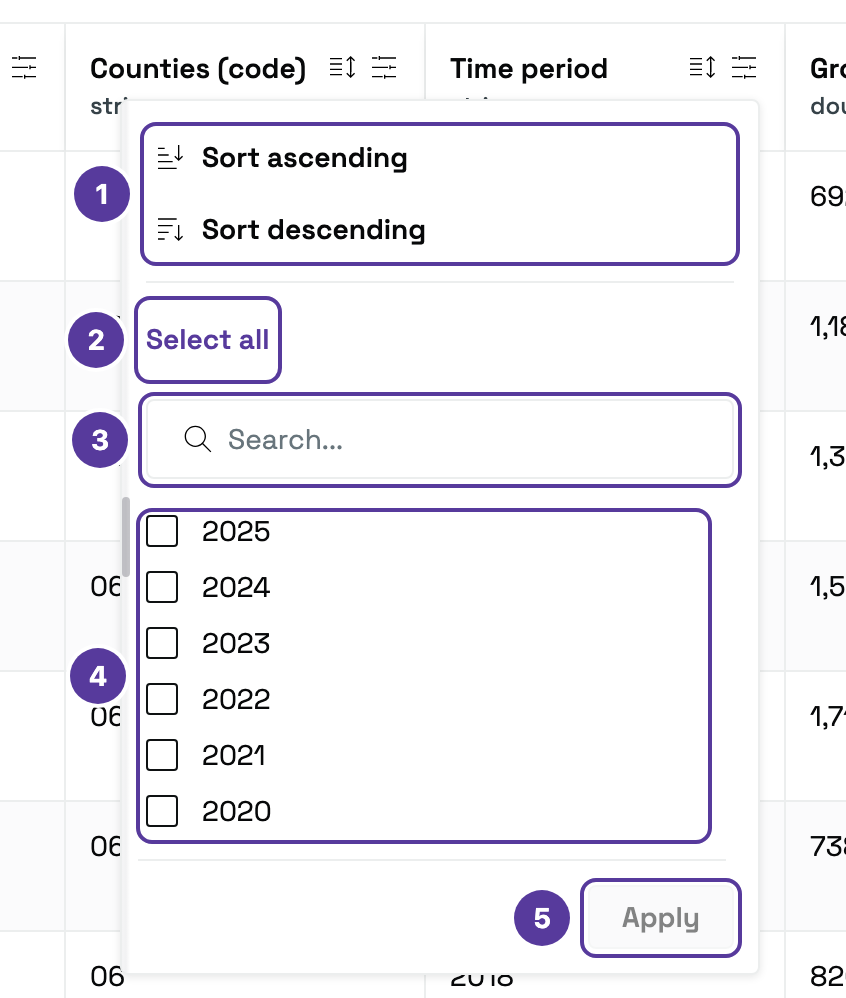
1. **Sorting** — the same as the sort icon.
2. **Select all** — ticks every value (once all are ticked, it switches to clearing them).
3. **Search** — finds a value in a long list quickly, one municipality for example.
4. **Values** — tick the ones you want to keep.
5. **Apply** — filters the rows.
In a numeric column (type `double` or `integer`) a **Number filter** replaces the list of values: enter the lowest and highest value. There you can also **Hide empty values**, and **Restore** returns to the full range.
## Columns [#columns]
The **Columns** button (2) opens the **Column editing** side panel, where each column under **Active columns** can be switched on or off.
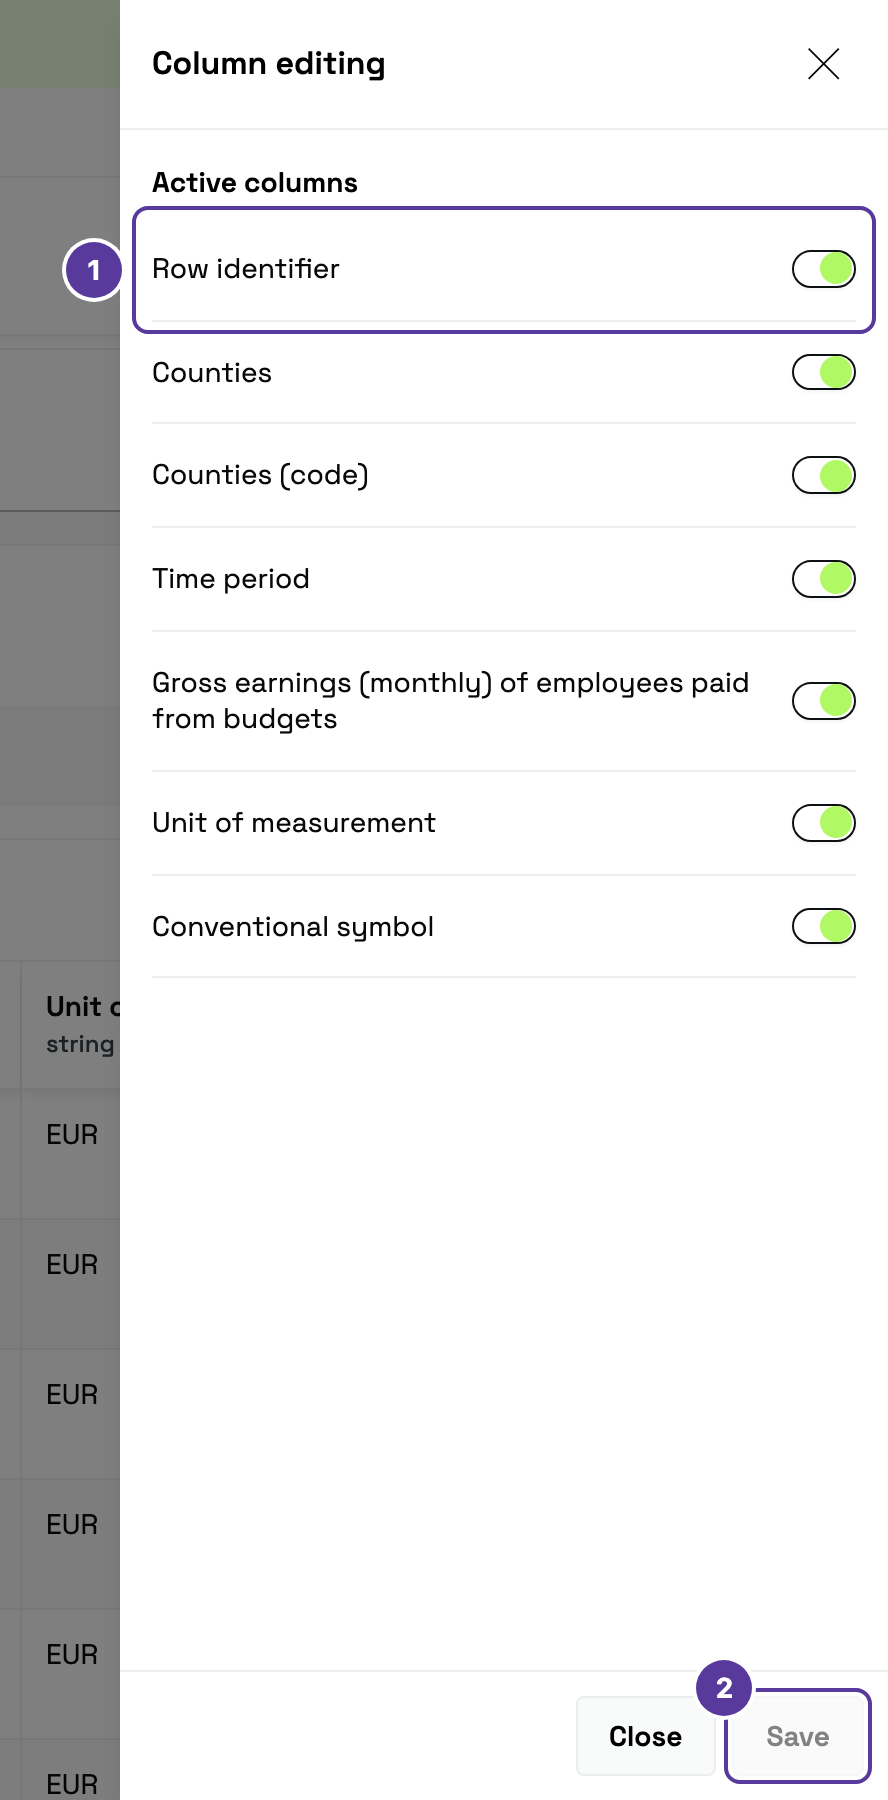
1. **A column toggle** — a column that is on (green) is shown, one that is off is hidden. Here *Row identifier* is marked.
2. **Save** — applies the changes ( **Close** dismisses the panel without changing anything).
* **Turn off the "Row identifier".** The table opens with a technical code (for example `fc9ff094-fe94-…`) meant for systems, not for reading. In **Column editing**, switch off its toggle and click **Save** — especially on a phone, where this column fills the whole first screen.
Under each column header (4 in the image above) is the data type: `string` for text, `double` for a decimal number, `integer` for a whole number.
## Row filters [#row-filters]
The **Filters** button (3) opens a side panel with every column in one place — handy when you filter by several columns at once, such as one year and one county.
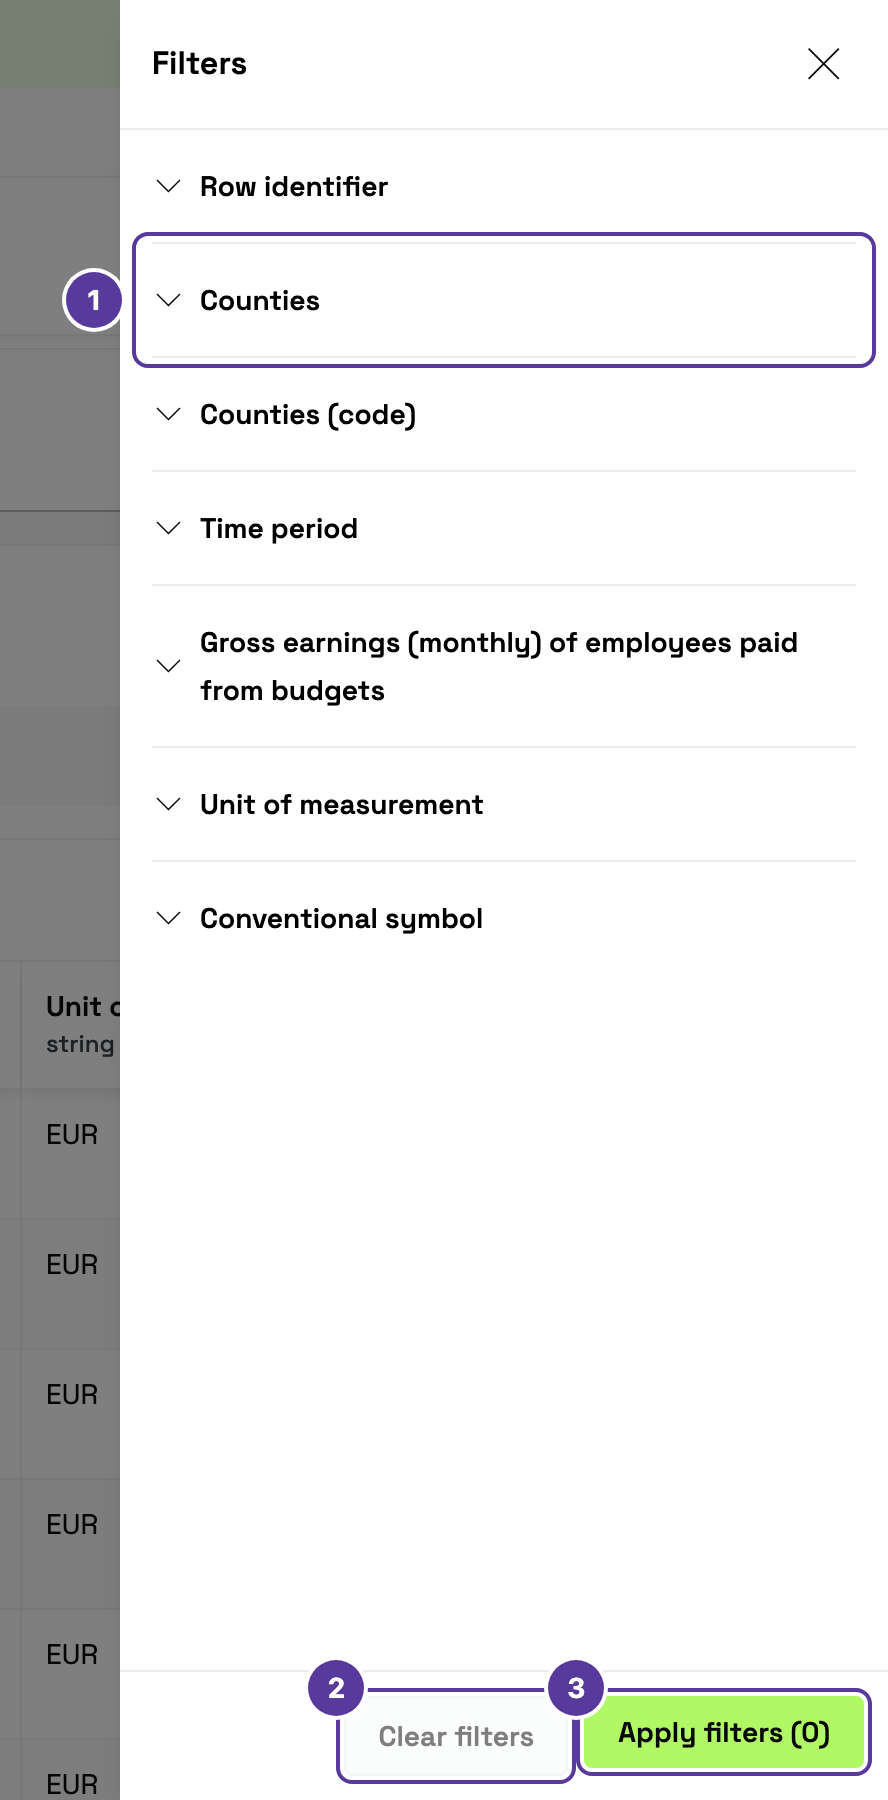
1. Each column is an **expandable row**; click it to reveal the same conditions as in the [column menu](#the-column-menu).
2. **Clear filters** — removes every filter in one click.
3. **Apply filters** — applies your choices; the number in brackets shows how many filters are currently active.
Filters matter beyond the preview: on export you can choose whether to download **all** data or only the **filtered** data.
## Empty values and conventional symbols [#empty-values-and-conventional-symbols]
A dash `-` in a cell means the cell is empty. When the indicator's value itself is empty, the **Conventional symbol** column explains why, in words — for example, that the indicator is not calculated for that combination, that data is not available or that it is confidential. The same column also flags values that are provisional or revised. A `-` in the **Conventional symbol** column means there is no note for that row.
## Structure [#structure]
The **Structure** view shows the **row count** and **column count** at the top, and below them a table of every column:
| Column | What it shows |
| ------------- | --------------------------------------------------------------------------------------------------------------------------- |
| **Title** | The column's name in the table, for example *Time period*. |
| **API name** | Its technical name, for example `time_period` — use it in queries through the [API](https://guides.dataportal.gov.lt/docs/guide/browsing-data/downloading). |
| **Data type** | `string`, `double` or `integer`. |
Want to know what exactly an indicator measures? That is explained not here but in the documentation on the [**Metadata** tab](https://guides.dataportal.gov.lt/docs/guide/browsing-data/dataset-page#metadata).
## Distribution information [#distribution-information]
The **Distribution information** view holds the technical details of this distribution — the table in one language:
* **Identifier** and **Another identifier** — for example `sdr003146_en` and the statistical table code `S3R640_M3060807_1_en`;
* **Language**, **Description** and **Status**;
* **Access URL** — the API address with a copy button — **Access service** and **Availability level**;
* **Format** (for example *Parquet*, *CSV*, *JSON*), **Media type**, **Packaging format**, **Size** and **Checksum**;
* **Publish date** and **Modified date**;
* **License**, **Applicable legislation**, **ODRL policy** and **Distribution rights**;
* **Spatial resolution**, **Temporal resolution** and **Linked schemas**.
Most of these fields repeat the [metadata](https://guides.dataportal.gov.lt/docs/guide/browsing-data/dataset-page#metadata); here they describe the specific table, such as its language and API address.
Once you have what you need, move on to [downloading](https://guides.dataportal.gov.lt/docs/guide/browsing-data/downloading).
# Downloading and export (https://guides.dataportal.gov.lt/docs/guide/browsing-data/downloading)
You can take the data away as a file or fetch it programmatically — both sit behind the green **Export** button in the data table's header.
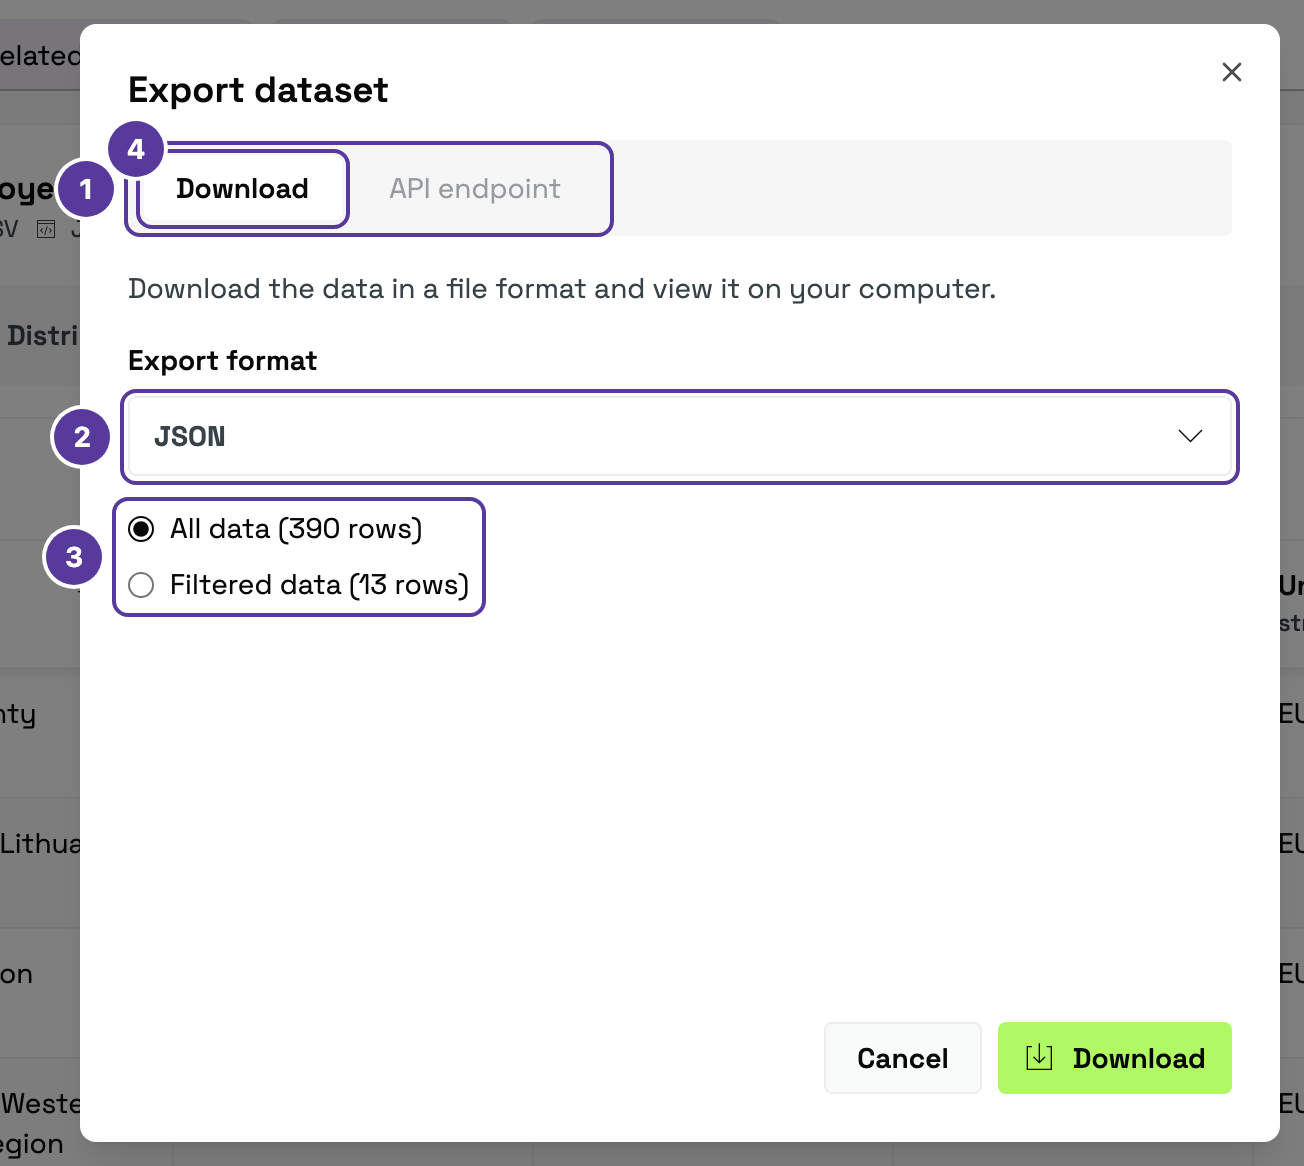
1. The **Download** and **API endpoint** tabs.
2. **Export format** — *JSON* is selected to start with.
3. **Scope** — **All data** or **Filtered data**; the row count is in brackets.
4. The **Download** button.
## Formats [#formats]
| Format | When to choose it |
| ----------- | ------------------------------------------------------------------------------------------------------------------------------------------ |
| **CSV** | The most universal. Opens in *Excel*, *LibreOffice*, *Google Sheets*. |
| **XLSX** | A native *Excel* workbook — opens straight in *Microsoft Excel*. Capped at 1,000,000 rows: filter larger tables, or choose CSV or Parquet. |
| **JSON** | When a program or script will process the data. |
| **NDJSON** | Newline-delimited JSON — one record per line, handy for streaming or reading large files line by line. |
| **Parquet** | For large volumes and analysis with *Python*, *R* or data tooling. |
**JSON** is selected to start with. If you want to open the data in a spreadsheet, choose **CSV** or **XLSX**.
## Downloading a file [#downloading-a-file]
### Open export [#open-export]
Click **Export** in the table's header. The **Export dataset** window opens on the **Download** tab.
### Pick the format [#pick-the-format]
In the **Export format** list, choose *JSON*, *NDJSON*, *CSV*, *Parquet* or *XLSX* (see the table above).
### Pick the scope [#pick-the-scope]
**All data** is selected to start with. If you applied [filters](https://guides.dataportal.gov.lt/docs/guide/browsing-data/table#row-filters) to the table and want only those rows, select **Filtered data** — otherwise the file contains every row.
### Download [#download]
Click **Download** — the file is saved to your computer.
## Fetching it through the API [#fetching-it-through-the-api]
In the same window, the **API endpoint** tab shows a ready-made request you can copy and run on your own machine:
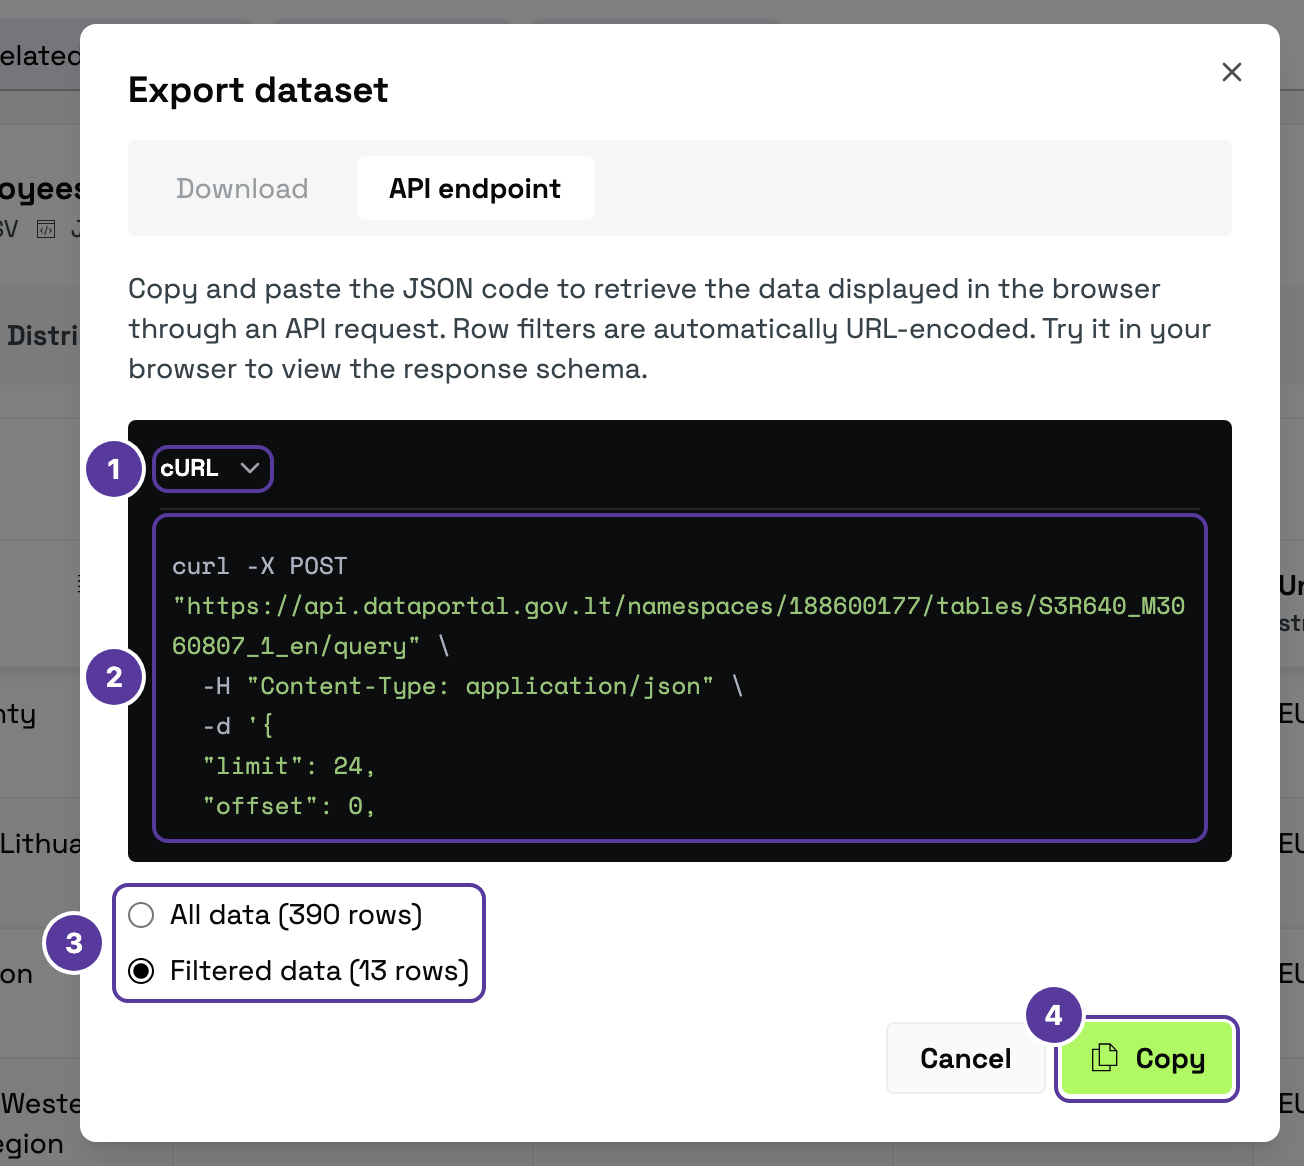
1. **Language** — *cURL* (for the command line) or *Python* (with the `requests` library).
2. **The request** — the address and the request body.
3. **Scope** — with **Filtered data** selected, the table's filters are written into the request.
4. **Copy** — copies the request.
For example, the request for “Gross earnings (monthly) of employees paid from budgets | Counties” with the table filtered to 2024:
```bash
curl -X POST "https://api.dataportal.gov.lt/namespaces/188600177/tables/S3R640_M3060807_1_en/query" \
-H "Content-Type: application/json" \
-d '{
"limit": 24,
"offset": 0,
"filter": "time_period._co=2024"
}'
```
* `188600177` is the publisher's code and `S3R640_M3060807_1_en` the table name (the `_en` or `_lt` ending sets the language).
* `filter` holds the table's filters; it appears only with **Filtered data** selected. It uses the columns' API names, which differ by language: `time_period` in the English table, `laikotarpis` in the Lithuanian one.
* `limit` and `offset` set how many rows to return and where to start.
The ready-made request has `"limit": 24` — as many rows as one page of the table. The response's `total` field gives the full number of rows (13 in this example). To get them all, raise `limit` (to `1000`, say) or send several requests, increasing `offset`. Without `limit`, the API returns 100 rows.
The response is JSON: the rows in `data` (their keys are the columns' [API names](https://guides.dataportal.gov.lt/docs/guide/browsing-data/table#structure)), plus `total`, `total_pages` and `current_page`.
* **For regular use, reach for the API.** The full set of query options — filtering, sorting, column selection and paging — is covered in the [Data API documentation](https://guides.dataportal.gov.lt/docs/api).
# Classifications (https://guides.dataportal.gov.lt/docs/guide/classifiers)
This portal section goes live on 1 October 2026. Until then the information here may change.
Classifications are standardised lists of codes and values that datasets rely on (for example, NACE 2.1 — the classification of economic activities).
## What you will be able to do [#what-you-will-be-able-to-do]
* Browse the catalogue of national and international classifications.
* Open a specific classification and explore its codes and values.
*Detailed instructions will be added once the section is live.*
# News and insights (https://guides.dataportal.gov.lt/docs/guide/news)
The **News** menu brings together three sections. Each answers a different question:

1. **Calendar** — *when* data will be published or updated.
2. **Information reports** — *what is new*, explained in words, with charts and tables.
3. **Data insights** — *what the figures mean*: a short analytical comment on the latest indicators.
In the menu the middle section is labelled **Notifications**, while its own page is headed **Information reports**. Both refer to the same content.
## What the three sections share [#what-the-three-sections-share]
All three are built the same way, so once you know one, the others are familiar:
* **Keyword search** — the field above the list. Its placeholder tells you how many entries the section holds in total.
* **Date range** — the **Date from** and **Date to** fields, applied with **Search**.
* **Topic filter** — the same 13 [data topics](https://guides.dataportal.gov.lt/docs/guide/browsing-data) as the catalogue.
* **Sorting** — the **Newest** button at the top right.
* **Paging** — 24 entries per page; a line above the list shows which part you are seeing (for example, "Showing 1–24 of 4,409").
The filters you choose are written into the address. Copy it from the browser and you keep — or can send a colleague — exactly the same view, for example the calendar for a single topic.
* **Don't want to check yourself?** [Subscribe](https://guides.dataportal.gov.lt/docs/guide/subscription) — updates for your chosen topic arrive by email.
* Calendar entries are linked to datasets: from an entry you can go straight to the [dataset page](https://guides.dataportal.gov.lt/docs/guide/browsing-data/dataset-page).
# Calendar (https://guides.dataportal.gov.lt/docs/guide/news/calendar)
The [Calendar](https://dataportal.gov.lt/en/calendar) shows **when** new or updated data will appear on the portal. It covers more than releases of official statistics: open-data updates, classification changes, publications and use cases are all there — several thousand entries in total.
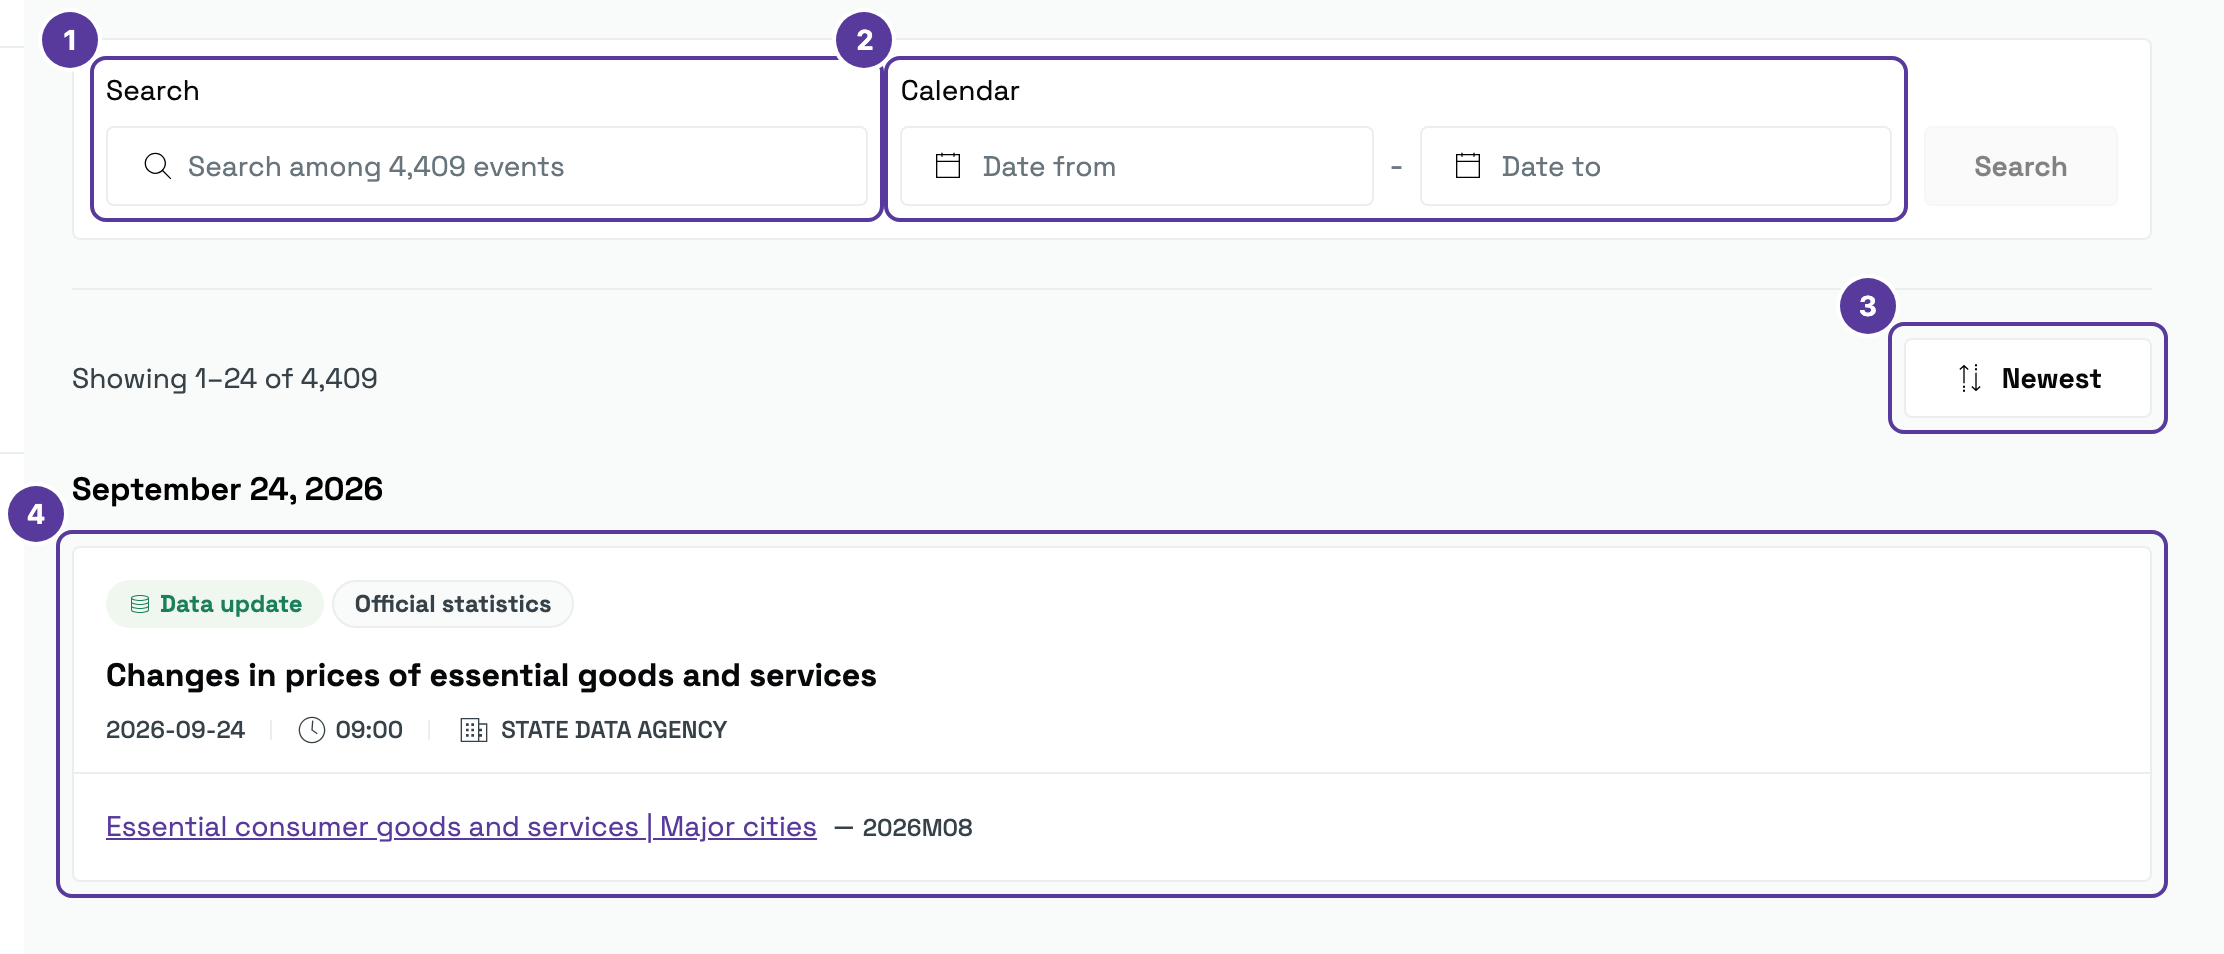
1. **Search** — a word from an indicator or publication name. The placeholder gives the total number of entries.
2. **Date range** — the **Date from** and **Date to** fields, applied with **Search**.
3. **Sorting** — **Newest**, which reverses the order. To its left, a line shows which part you are seeing ("Showing 1–24 of …").
4. **An entry** — one release. Entries are grouped by day, with a heading (for example, **24 September 2026**) separating each date.
The calendar holds both releases that have happened and ones still to come. Entries that have not been published yet carry an orange **Not Published** tag and a calendar icon.
## How to read an entry [#how-to-read-an-entry]
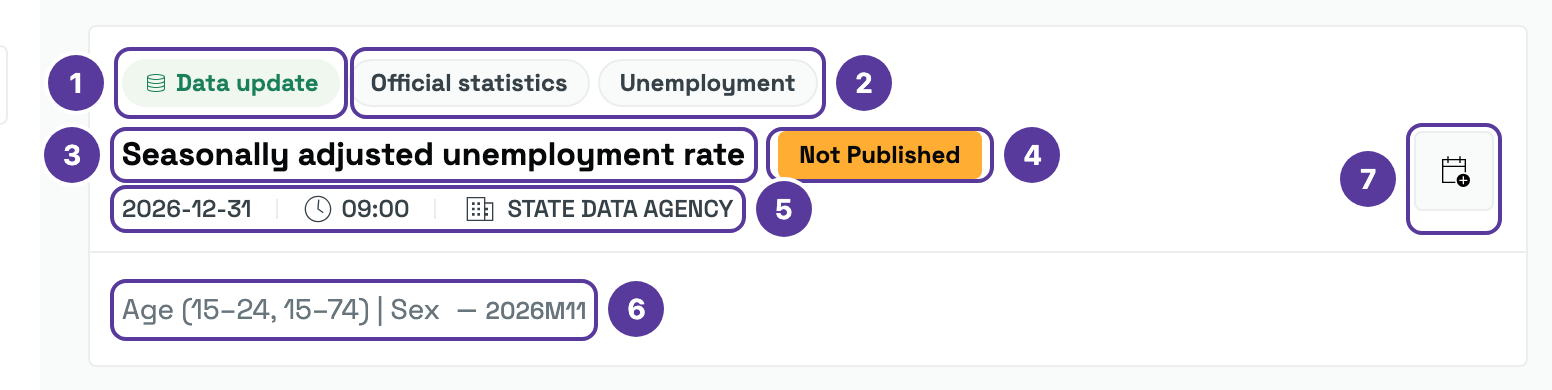
The entry in the picture has not been published yet, so all seven parts are visible.
1. **Event type tag** — what the portal will do that day, for example *Data update*.
2. **Publication type tag** — what kind of content it will be, for example *Official statistics*. There may be several tags, including the subject area ( *Unemployment*).
3. **Title** — the name of the indicator or publication.
4. **The "Not Published" tag** — the orange tag means the release time has not arrived yet. Published entries do not carry it.
5. **Date, time and publisher** — the exact day, the hour (usually **09:00**) and the institution, most often the *State Data Agency*.
6. **Linked breakdown and period** — which breakdown of the dataset will be updated ( *Age | Sex*) and for which period ( *2026M11*). On published entries this is a link to the [dataset page](https://guides.dataportal.gov.lt/docs/guide/browsing-data/dataset-page); there may be several breakdowns.
7. **Calendar icon** — downloads the entry as an `.ics` file. It appears **only on entries that have not been published yet**.
The calendar icon shows up only next to entries that are still to come — there is nothing to put in a calendar once a release has happened. It downloads an `.ics` file named after the indicator (for example, `butiniausiu-prekiu-ir-paslaugu-kainu-pokyciai.ics`). Opening it adds the release date to your calendar application — Outlook, Google Calendar or another — together with a reminder.
The quickest way to find upcoming entries is to put tomorrow's date, or a later one, in **Date from** and press **Search**.
## Filters [#filters]
The filter panel has four groups. You can tick several values within a group and combine groups with each other.
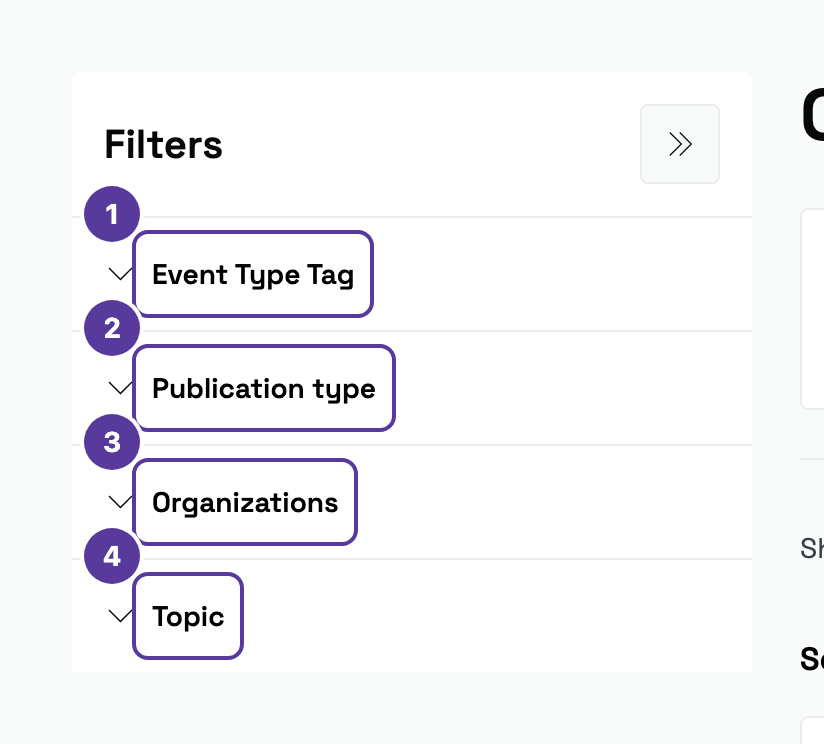
1. **Event type tag** — what the portal will do that day.
2. **Publication type** — what kind of content will be released.
3. **Organizations** — the institution publishing the data.
4. **Topic** — the subject area.
Each group's values are below. The groups are collapsed in the picture so all four fit; on the portal they are open.
What will happen on the given day. Five values:
* **Data update** — an existing dataset gains new data.
* **Data publication** — a new dataset is released.
* **Information publication** — a report, publication or other text is released.
* **Use case update** — a [use case](https://guides.dataportal.gov.lt/docs/guide/use-cases) is revised.
* **Use case publication** — a new use case is released.
The nature of the content. Eighteen values: *Article*, *Code list*, *Dashboard*, *Data application*, *Experimental statistics*, *Geospatial data*, *Infographic*, *Informational release*, *International classifier*, *Map / atlas*, *National classifier*, *Official statistics*, *Open data*, *Publication*, *Report / analysis*, *Requested government data*, *Scientific publication* and *Taxonomy*.
The group has its own search box, so there is no need to scroll the long list.
The institution publishing the data. The list holds close to four hundred bodies — ministries, municipalities, agencies and state-owned companies. This group also has a search box, so typing part of a name is quickest.
The same 13 data topics as the [catalogue](https://guides.dataportal.gov.lt/docs/guide/browsing-data) — from *Environment* and *Economy and finance* to *Health* and *Transport and communications*.
## Searching a period [#searching-a-period]
### Type a word [#type-a-word]
In the search field, type part of an indicator or publication name.
### Set the period [#set-the-period]
In **Date from** and **Date to**, choose a range — the coming month or quarter, for example.
### Press **Search** [#press-search]
The dates apply only once the button is pressed. Tick boxes in the filter panel take effect immediately.
* **Following one subject area?** Tick a **Topic** and the **Data update** event type — you then see that area's update schedule alone, without reports and publications.
* **Planning work around a release?** Open the dataset page from the entry and check which [breakdown](https://guides.dataportal.gov.lt/docs/guide/browsing-data/table) and period it covers.
* Dates and times are Lithuanian time.
# Information reports (https://guides.dataportal.gov.lt/docs/guide/news/reports)
[Information reports](https://dataportal.gov.lt/en/news) are the texts in which the State Data Agency presents statistics it has just released: "Results of the population health statistical survey", "Overview of the labor market" and the like. Unlike [data insights](https://guides.dataportal.gov.lt/docs/guide/news/insights), these are full articles with charts, tables and explanations.
The **News** menu calls this section **Notifications**; the section's own page is headed **Information reports**. They are the same thing.
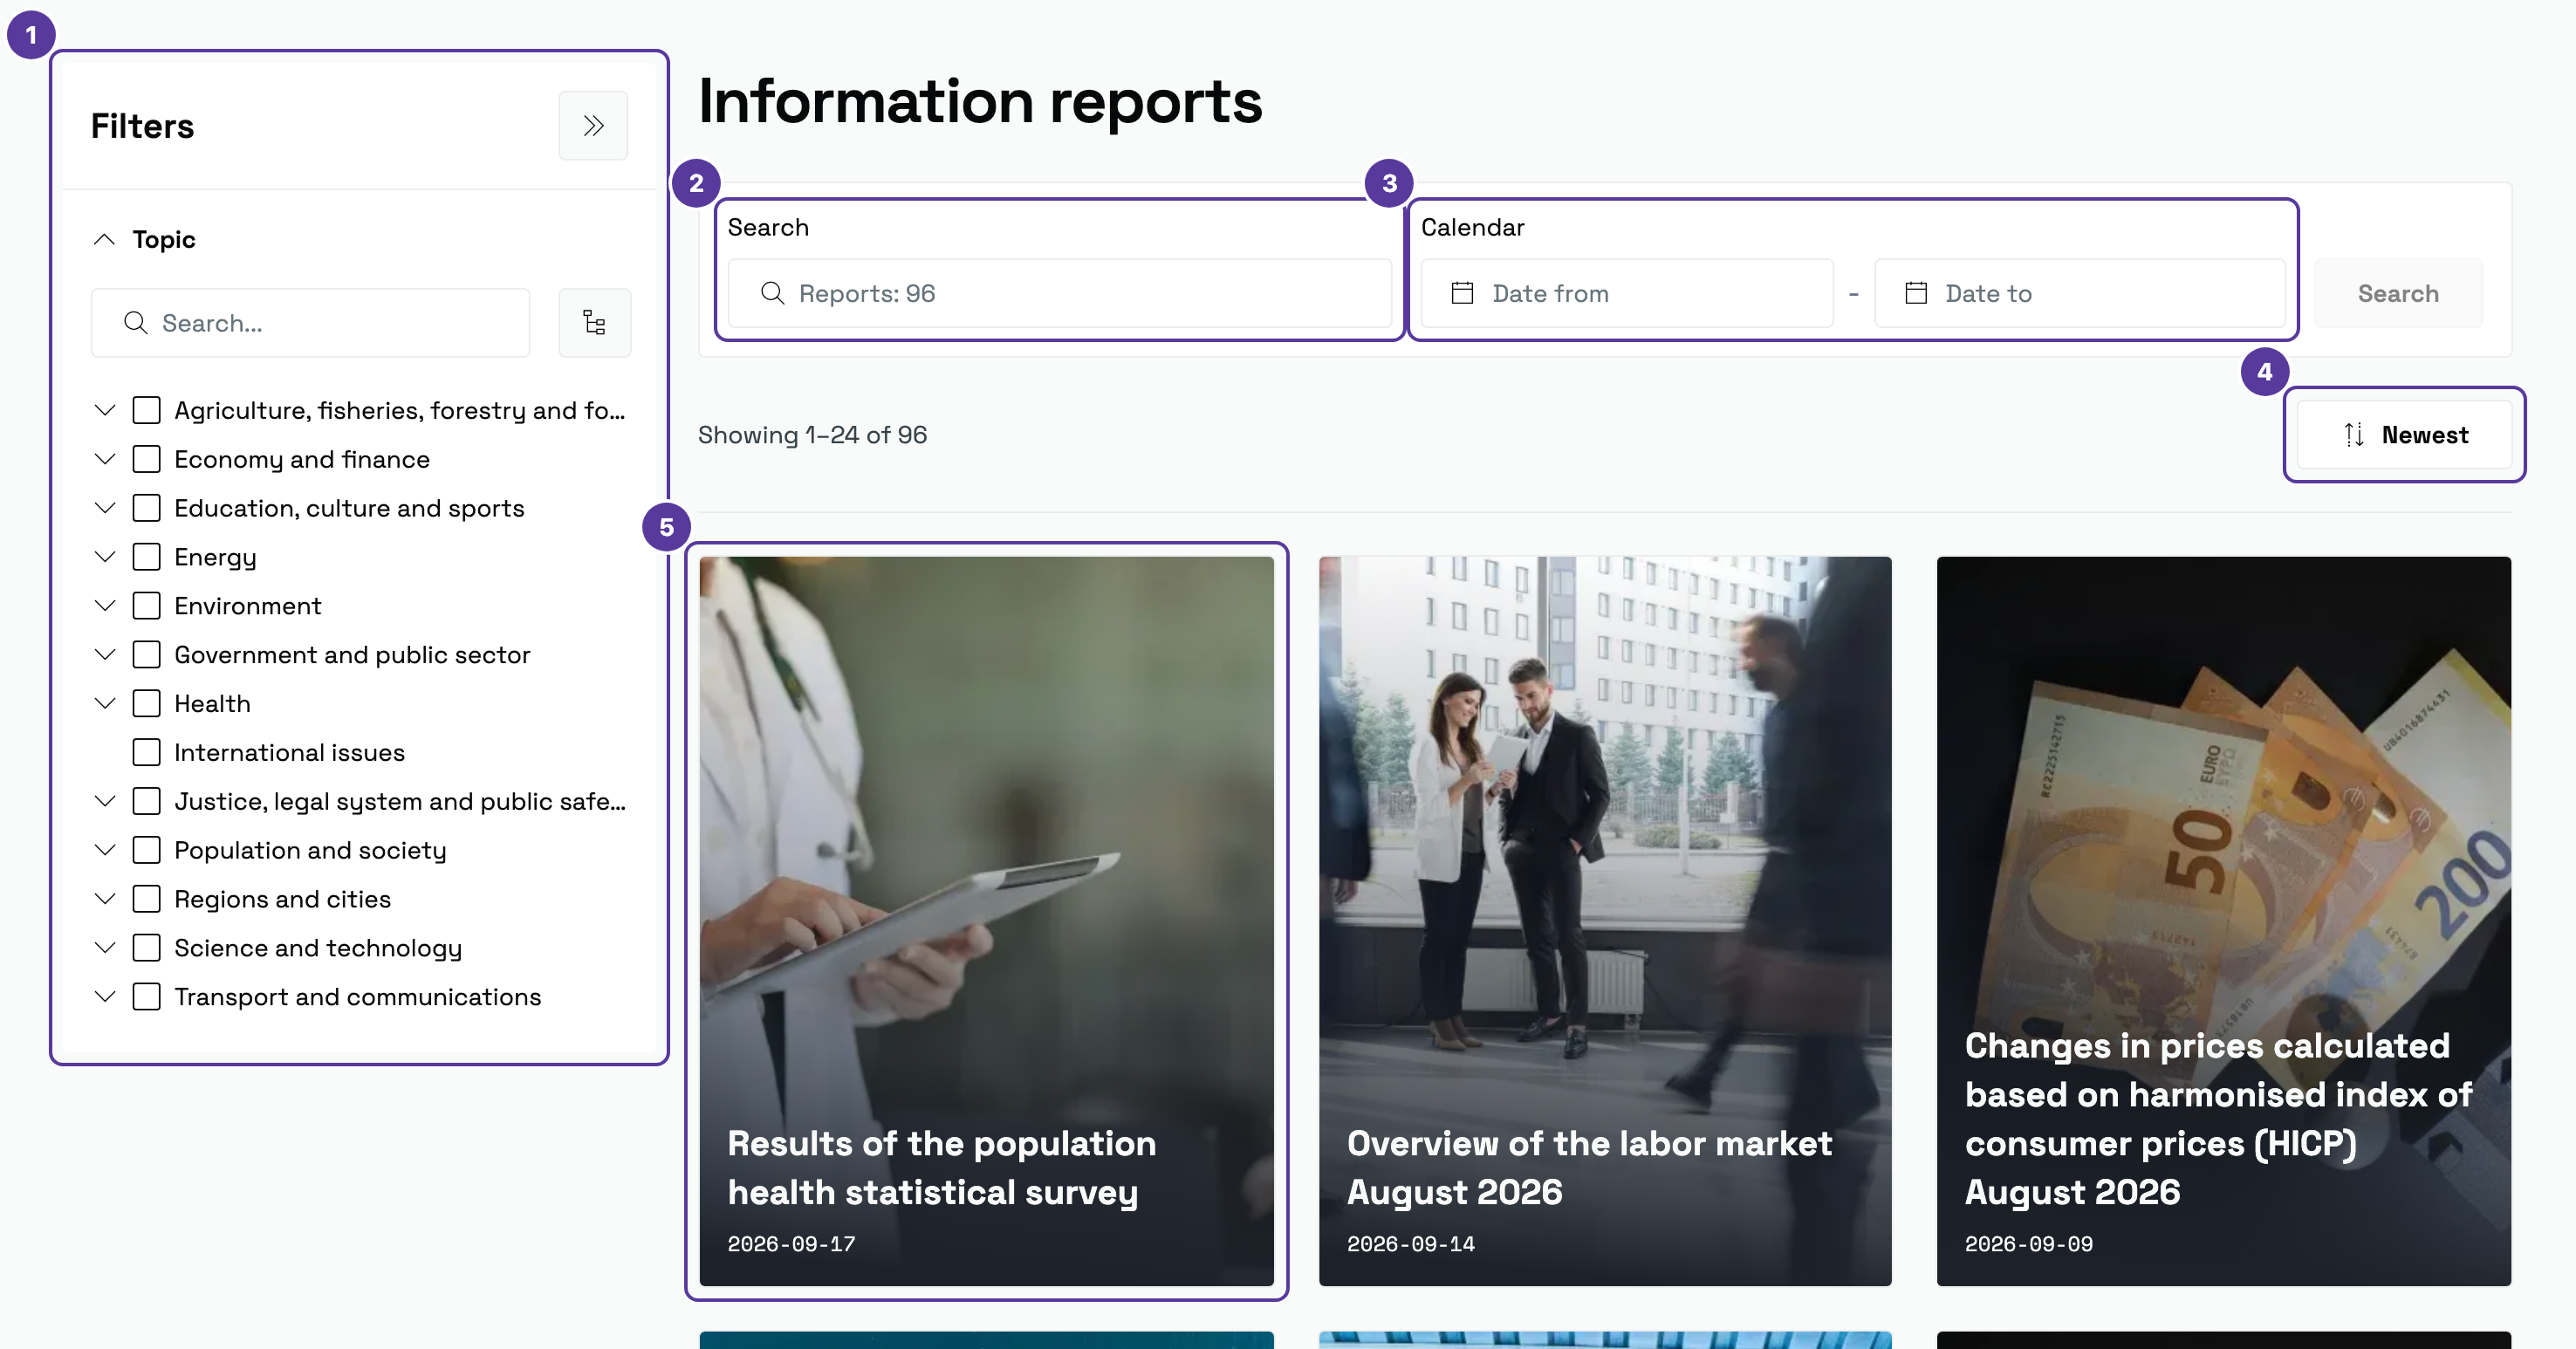
## The list and its filters [#the-list-and-its-filters]
1. **Filters** — a **Topic** group with the same 13 data topics as the [catalogue](https://guides.dataportal.gov.lt/docs/guide/browsing-data).
2. **Search** — part of a title or of the text; the placeholder gives the total number of reports.
3. **Date range** — **Date from** and **Date to**, applied with the **Search** button.
4. **Sorting** — **Newest**.
5. **A report card** — a photograph, the title and the publication date. Page numbers are at the bottom of the list.
## A report page [#a-report-page]

1. **Breadcrumb** — *Home / Information reports / title*; a quick way back to the list.
2. **Publication date**.
3. **Export PDF** — downloads the report as a PDF, with its charts.
4. **Link icon** — copies the report's address to the clipboard.
5. **Share icon** — offers to share the report.
The title, the illustration and the text itself follow.
### Interactive charts [#interactive-charts]
Charts in reports are not pictures — they can be explored. Depending on the subject, buttons under a chart let you:
* turn individual series on and off (for example, **Very good and good**, **Average**, **Bad or very bad**);
* switch between years (**2014**, **2019**, **2025**);
* choose a population group (**Total**, **Women**, **Men**).
Hovering over a chart shows the exact value.
A report explains what the statistics show, but it does not let you recalculate them your own way. When you need the figures themselves — other breakdowns, a longer time series or a download — find the dataset in the [catalogue](https://guides.dataportal.gov.lt/docs/guide/browsing-data) or open the [dataset table](https://guides.dataportal.gov.lt/docs/guide/browsing-data/table).
* **Need the report for a document?** **Export PDF** produces a tidy version with the charts — no screenshots required.
* **Interested in one subject area?** Tick a **Topic** and save the address; coming back shows only that area's reports.
* The portal's homepage also lists the newest reports, in its **Information reports** section.
# Data insights (https://guides.dataportal.gov.lt/docs/guide/news/insights)
[Data insights](https://dataportal.gov.lt/en/data-insights) are short analytical comments on the latest official statistics. Each says in a couple of sentences what the figures show: how much, when, and how it changed.
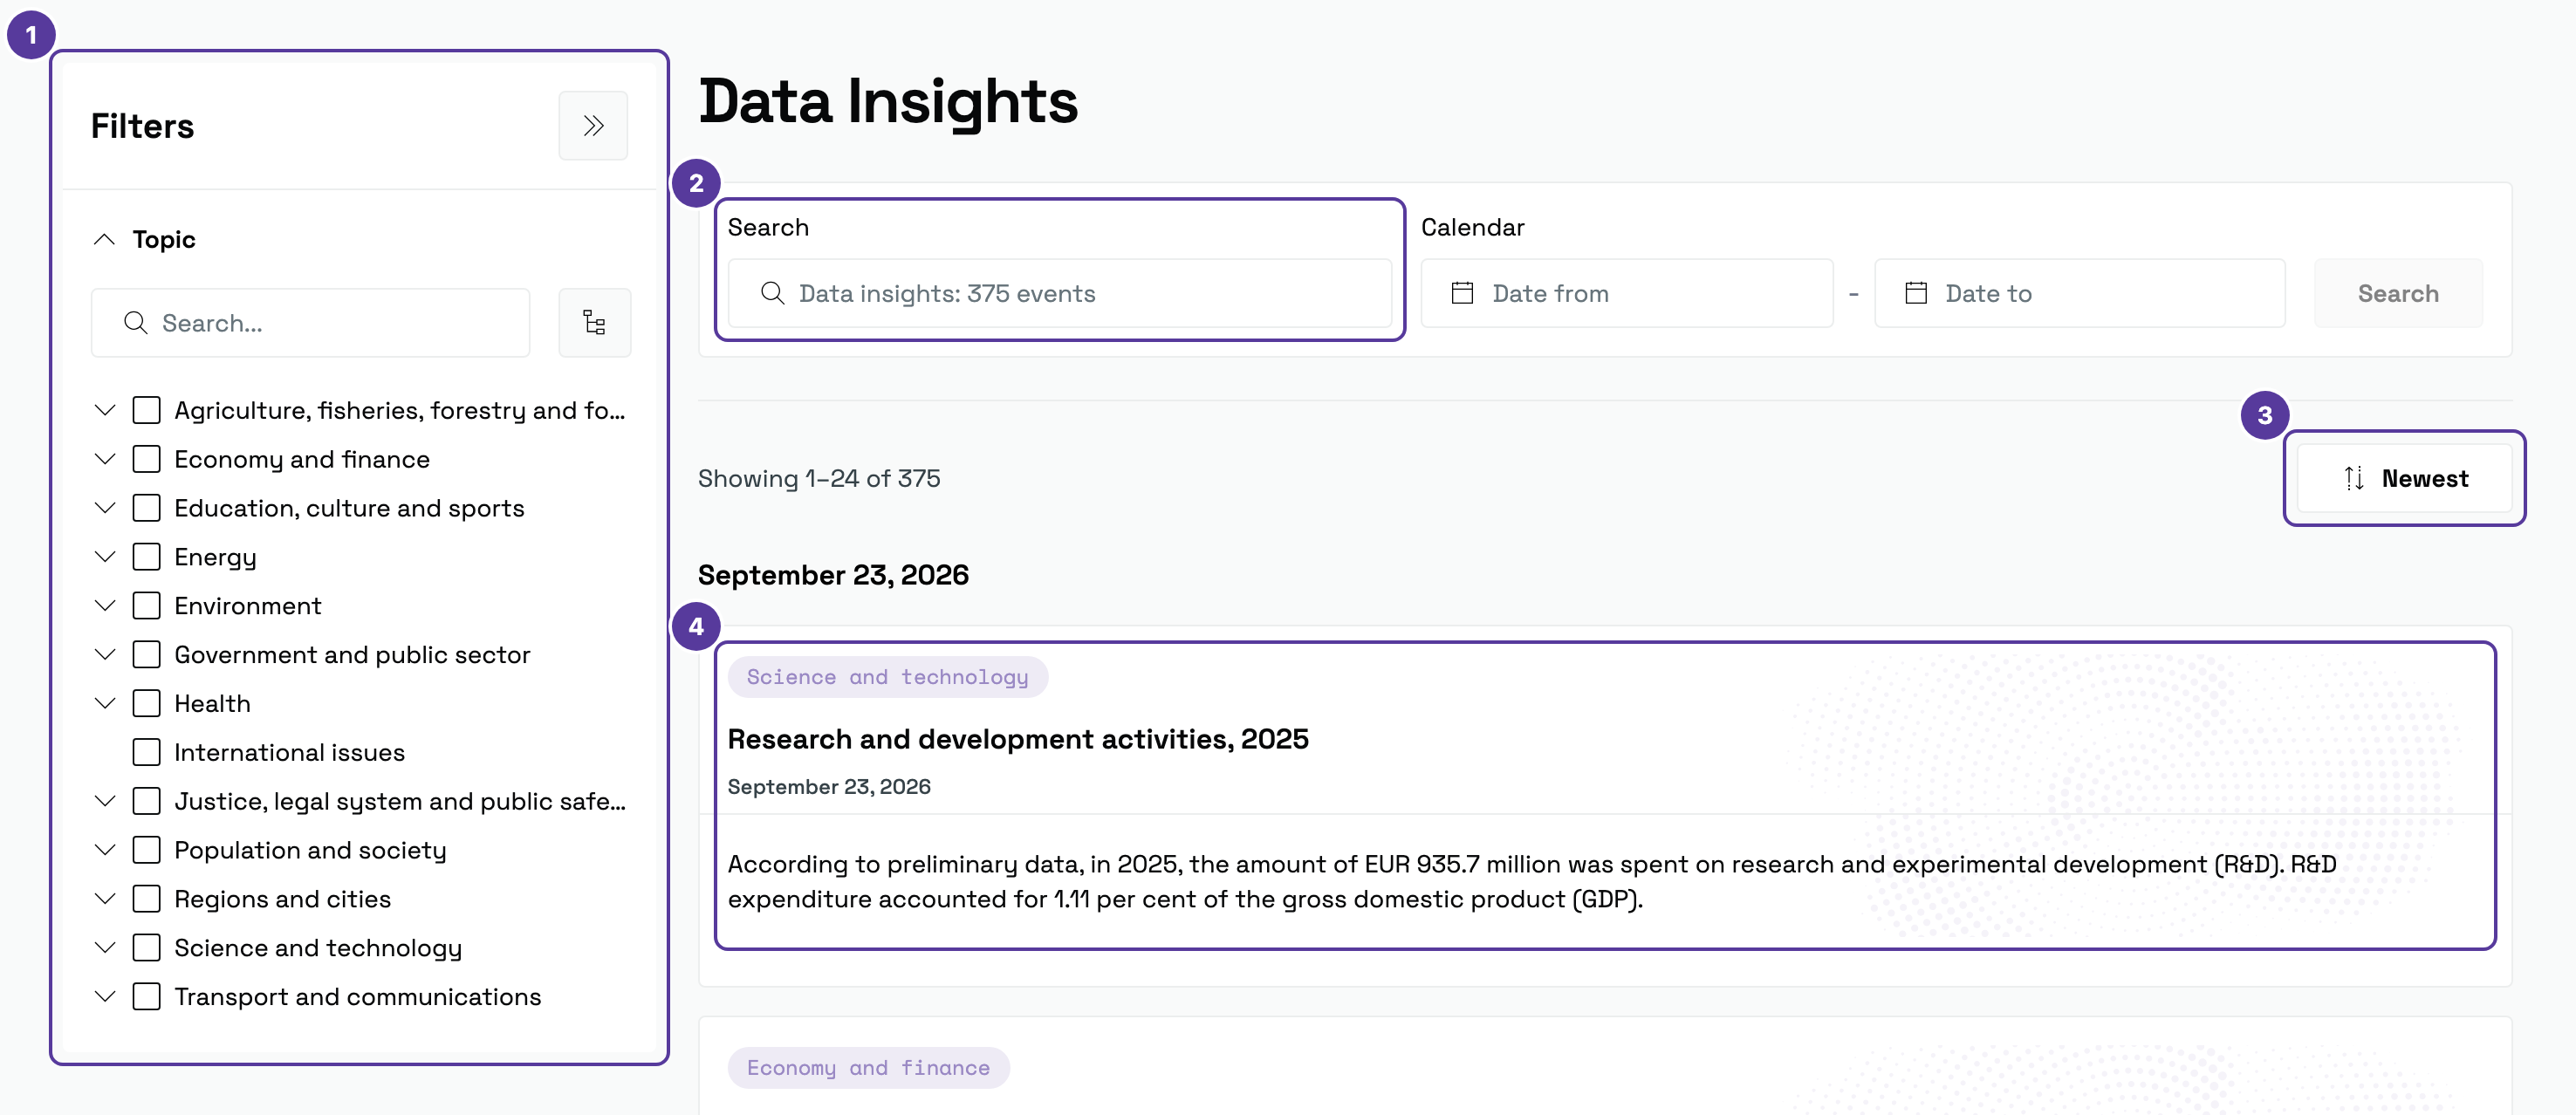
1. **Topic** — in the filter panel. Topics form a tree: the arrow beside a topic expands its sub-topics, so you can narrow further than the 13 main areas. The group also has a search box.
2. **Search** — a word from a title or a comment; the placeholder gives the total number of insights.
3. **Sorting** — **Newest**. To its left, a line shows which part you are seeing ("Showing 1–24 of …"); page numbers are at the bottom. The period is set with **Date from** and **Date to** and the **Search** button.
4. **An insight card** — the whole insight, read straight from the list.
## How to read an insight [#how-to-read-an-insight]
Insights are read in the list — they have no page of their own, so there is nowhere to click through to. A card carries:
* **A topic tag** (lilac) — the subject area, for example *Science and technology* or *Economy and finance*.
* **The title** with its period — for example, "Research and development activities, 2025".
* **The publication date**.
* **The comment** — one or two sentences with the key figures. For example: *"According to preliminary data, EUR 935.7 million was spent on research and development (R\&D) in 2025. R\&D expenditure accounted for 1.11 per cent of gross domestic product (GDP)."*
Entries are grouped by day, newest first.
## How they differ from information reports [#how-they-differ-from-information-reports]
| | Data insights | [Information reports](https://guides.dataportal.gov.lt/docs/guide/news/reports) |
| ----------------- | --------------------------- | ----------------------------------------------- |
| Length | One or two sentences | A full article |
| Where you read it | Straight from the list | On its own page |
| Charts | None | Interactive charts and tables |
| PDF | No | **Export PDF** |
| Good for | Seeing quickly what changed | Understanding context and detail |
The figure in an insight is a summary value. When you need a time series, other breakdowns or a download, find the dataset in the [catalogue](https://guides.dataportal.gov.lt/docs/guide/browsing-data) — [smart search](https://guides.dataportal.gov.lt/docs/guide/smart-search), where you can type a whole question, helps too.
* **Following one subject area?** Tick a topic and save the browser address — the filter travels with it.
* The portal's homepage also shows the newest insights.
* If an indicator mentioned in an insight matters to you regularly, check when it is updated in the [calendar](https://guides.dataportal.gov.lt/docs/guide/news/calendar).
# Use cases (https://guides.dataportal.gov.lt/docs/guide/use-cases)
Use cases — the portal also calls them **data products** and lists them as **Data reuses** — show how the data published on the portal is put to work: in dashboards, reports, maps or publications. For now, every use case is an interactive **dashboard**.
## Where to find them [#where-to-find-them]
* **The Data and statistics menu → Data products.** It has three items:
* **Browse the catalog** — the list of all use cases (described below).
* **About data products** — [what data products are](https://dataportal.gov.lt/en/about-data-products), who they are for, and frequently asked questions.
* **Sustainable development goals (SDGs)** — a separate website, [dvr.stat.gov.lt](https://dvr.stat.gov.lt/).
* **[Smart search](https://guides.dataportal.gov.lt/docs/guide/smart-search)** — tick the **Data reuses** filter.
* **The [dataset page](https://guides.dataportal.gov.lt/docs/guide/browsing-data/dataset-page)** — the **Data reuses** tab (usually empty for now).
## The list of use cases [#the-list-of-use-cases]
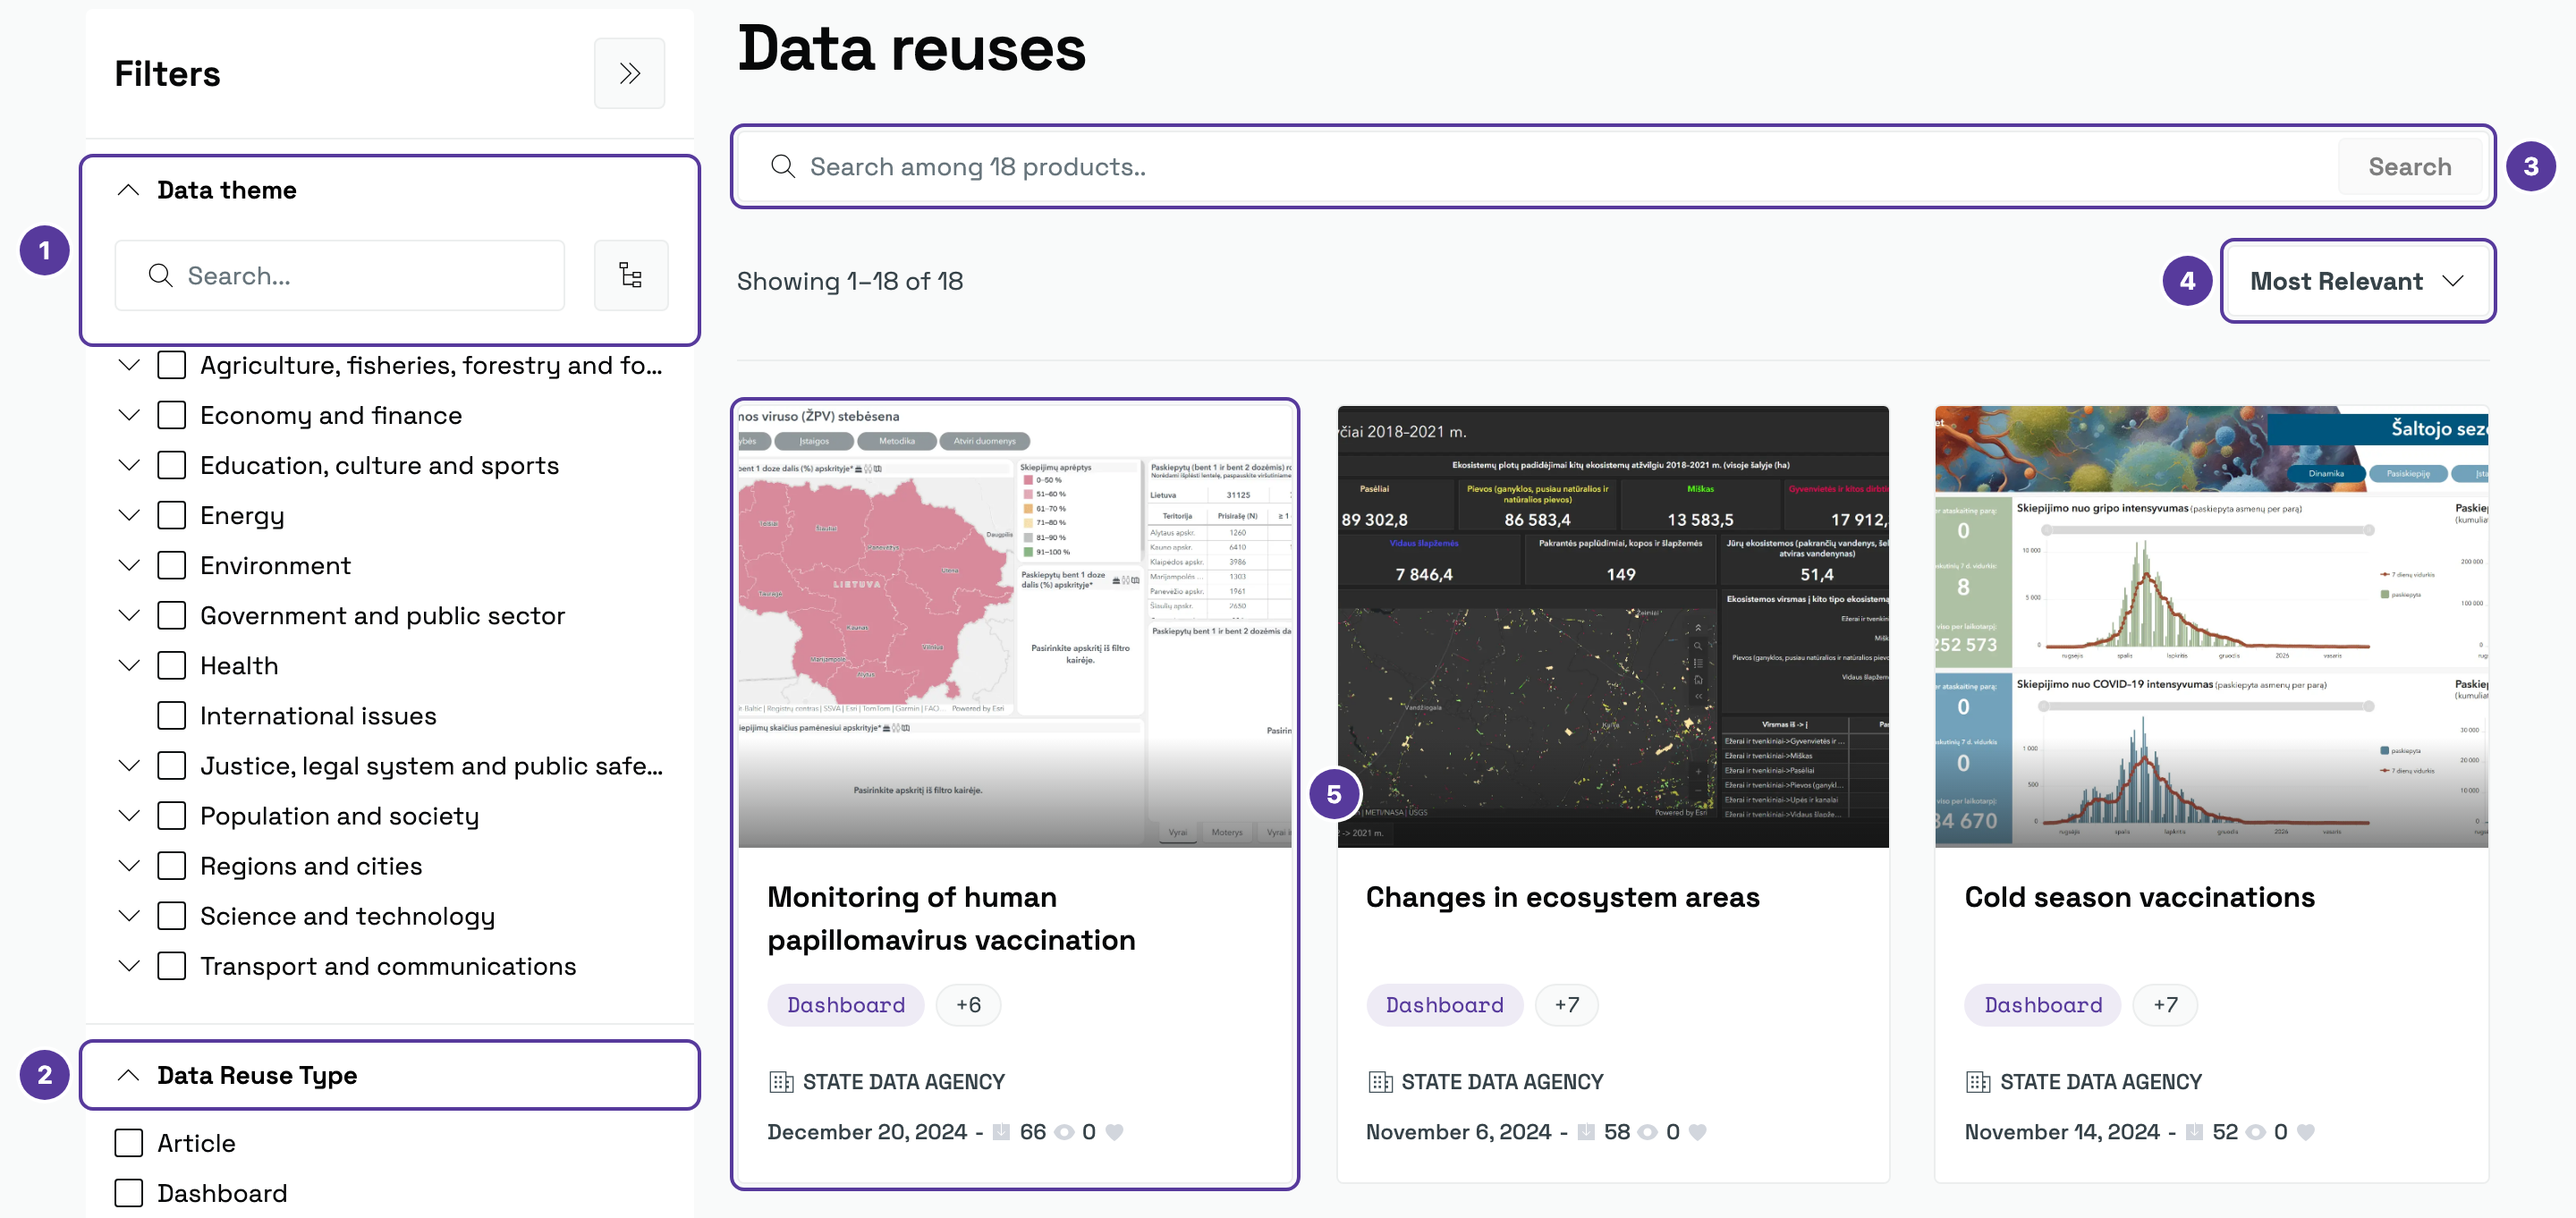
1. **Data theme** — the themes form a tree: the arrow beside a theme expands its sub-themes. The group has its own search box.
2. **Data Reuse Type** — *Article*, *Dashboard*, *Data application*, *Infographic*, *Map / atlas*, *Public release*, *Publication*, *Report*, *Research paper* and *Other*.
3. **Search** across all use cases.
4. **Sorting** — *Most Relevant*, *Newest*, *Oldest*, *Title A-z* or *Title Z-a*.
5. **A use-case card** — a preview, the title, the type, the publisher, the publication date and counters. “+6” means six more keywords: hover over it to see them.
## The use-case page [#the-use-case-page]
Click a card to open the use-case page:
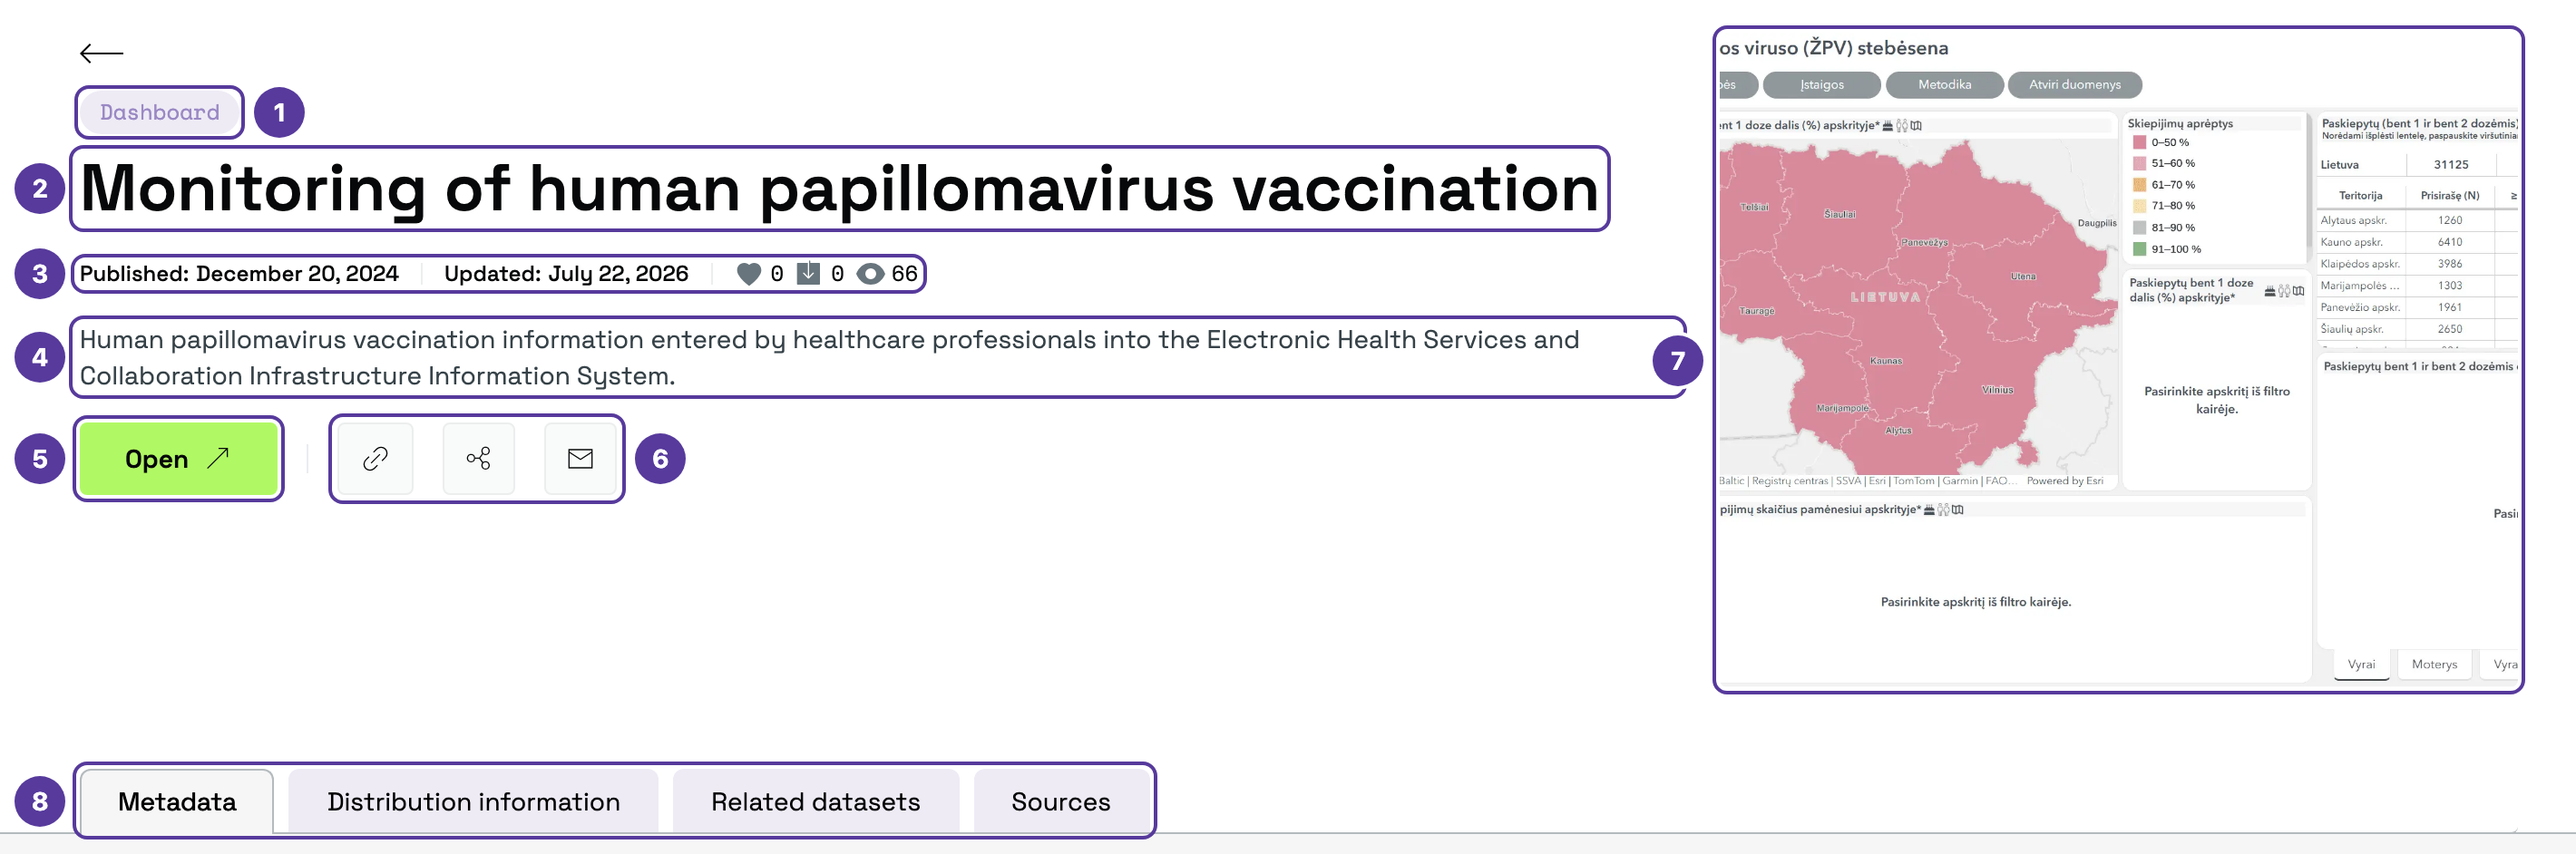
1. **Type** — for example, *Dashboard*.
2. **Title.**
3. **Publication and update dates**, and the number of likes, downloads and views.
4. **Description** — what the use case shows and where its data comes from.
5. **Open** — opens the product itself (see below).
6. **Copy link**, **Share** and the **Feedback form** — the same as on the [dataset page](https://guides.dataportal.gov.lt/docs/guide/browsing-data/dataset-page#cite-share-give-feedback).
7. **Preview** — what the product looks like.
8. **Tabs** — described below.
| Tab | What it holds |
| ---------------------------- | ----------------------------------------------------------------------------------------------------------------------------------------------------------- |
| **Metadata** | Creator and publisher, identifier (for example, `DR000005`), keywords, theme, access rights, geographical coverage, and publication and modification dates. |
| **Distribution information** | How the use case is delivered: the format (for dashboards, *HTML*), the access link and the **licence**. |
| **Related datasets** | The datasets the use case is built from. |
| **Sources** | Where the data came from. |
Below the tabs are other use cases by the same creator.
For now, the *Related datasets* and *Sources* tabs usually show “No data found” — the information has not been provided yet.
## Opening a use case [#opening-a-use-case]
**Open** opens the product itself. Where it opens depends on the product: dashboards currently open inside the portal, on their own page (its address ends in `/dashboard`), while other products — a publication or an application, for example — may be on an external website.
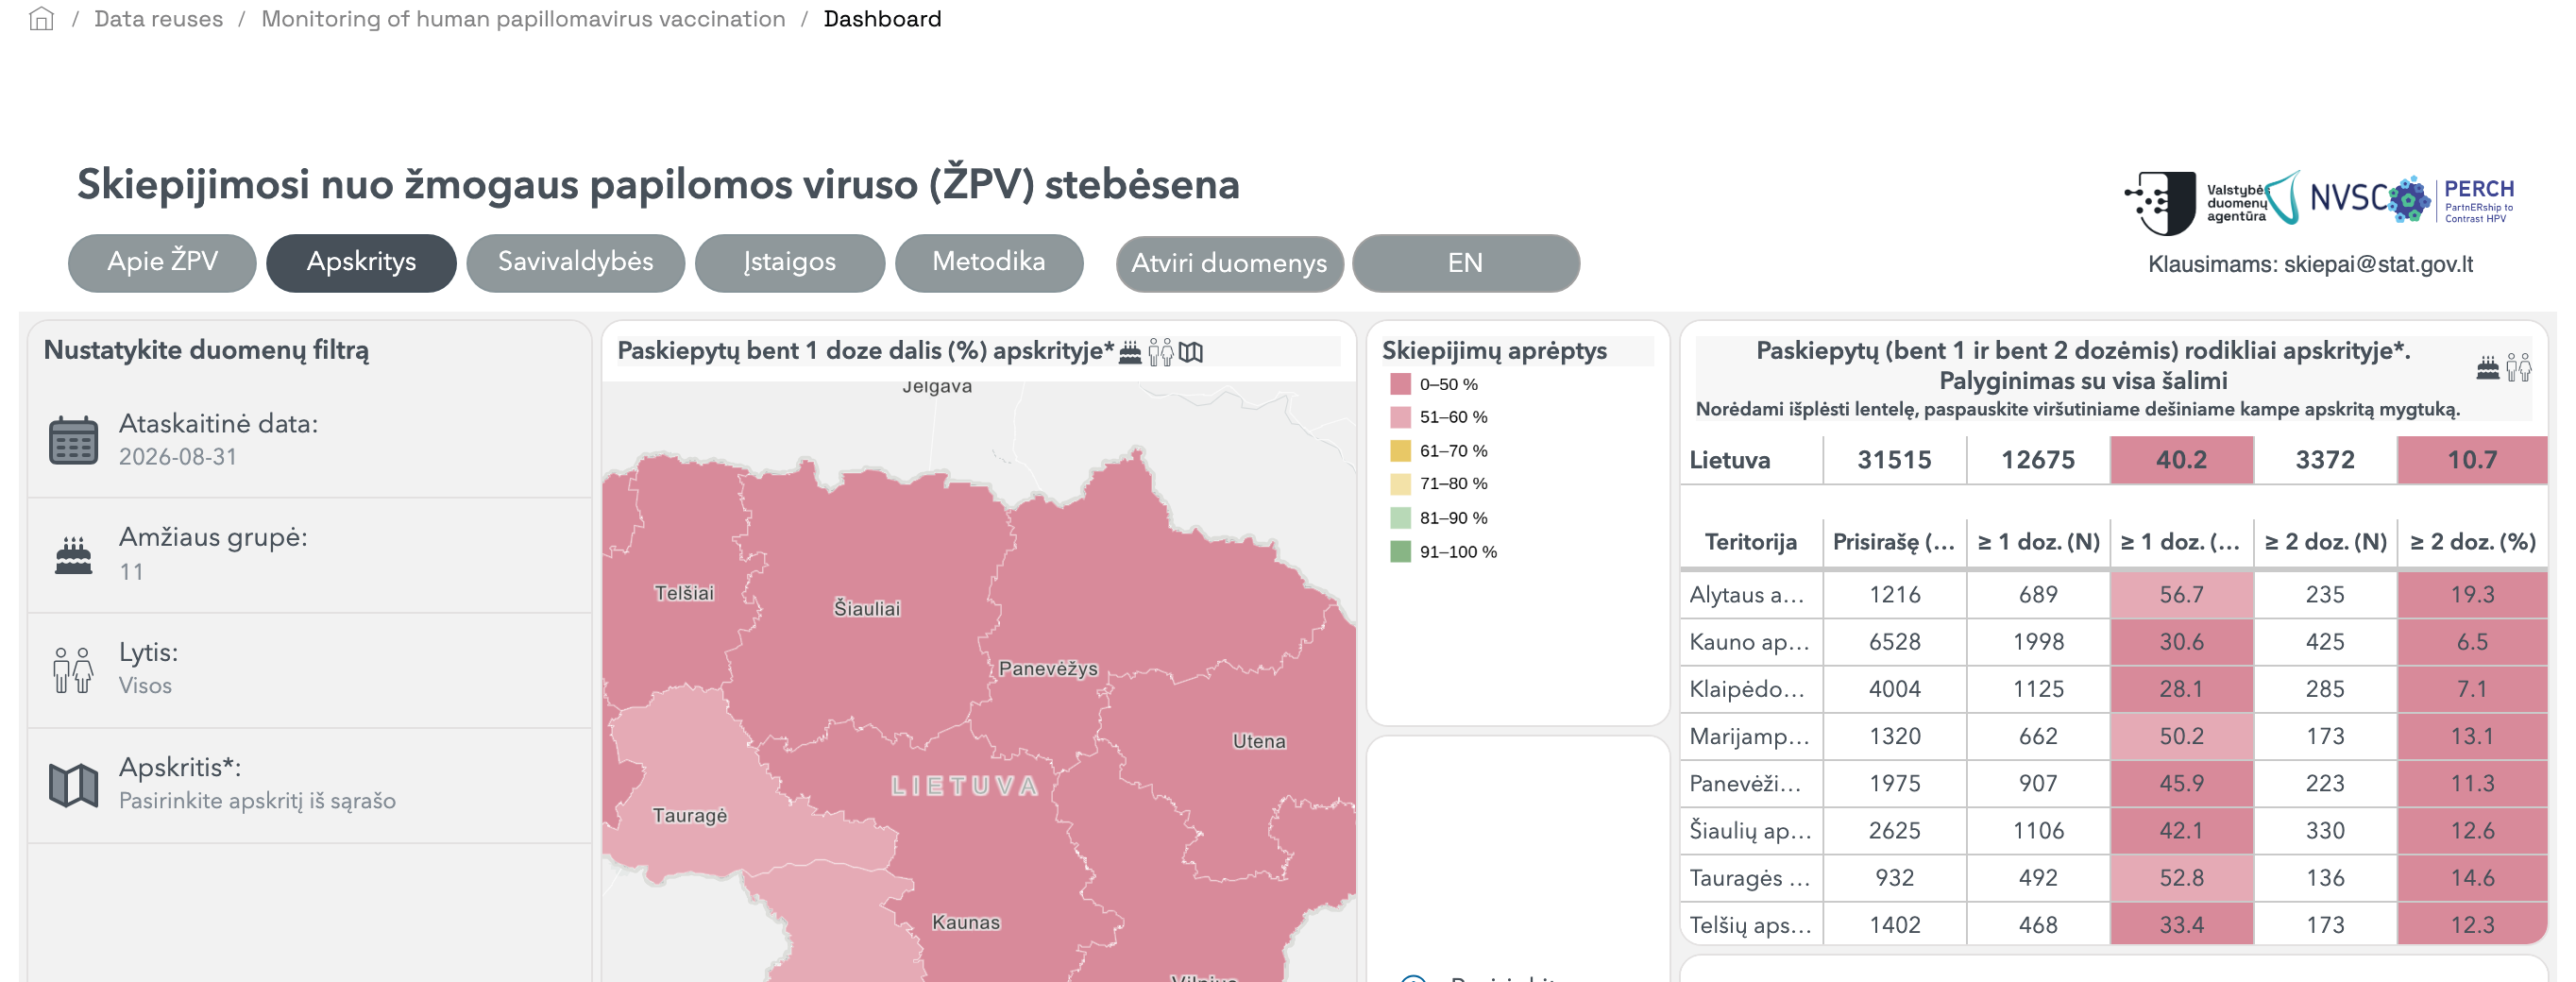
A dashboard is interactive: its filters, maps and tables belong to the dashboard itself, so each one looks different. Below it is a **More Dashboards** strip with other use cases. If you see “Failed to load content” instead of the dashboard, click **Refresh**.
The dashboards themselves are in Lithuanian even on the English portal. Some have their own **EN** switch at the top.
* **Want to share a dashboard?** Copy the use-case page's address with **Copy link**.
* **Need the figures themselves?** Find the indicators shown in a dashboard in the [catalogue](https://guides.dataportal.gov.lt/docs/guide/browsing-data) or with [smart search](https://guides.dataportal.gov.lt/docs/guide/smart-search) — there you can [download](https://guides.dataportal.gov.lt/docs/guide/browsing-data/downloading) them.
# Services (https://guides.dataportal.gov.lt/docs/guide/services)
The section is already visible on the portal but officially goes live on 1 October 2026. Until then the information here may change. For now, only the **Data Access** service can be ordered online.
In the [**Services**](https://dataportal.gov.lt/en/services) section (in the portal's top menu), the State Data Agency (SDA) offers services ranging from data access to analytical infrastructure, training and opening up data.
## The list of services [#the-list-of-services]
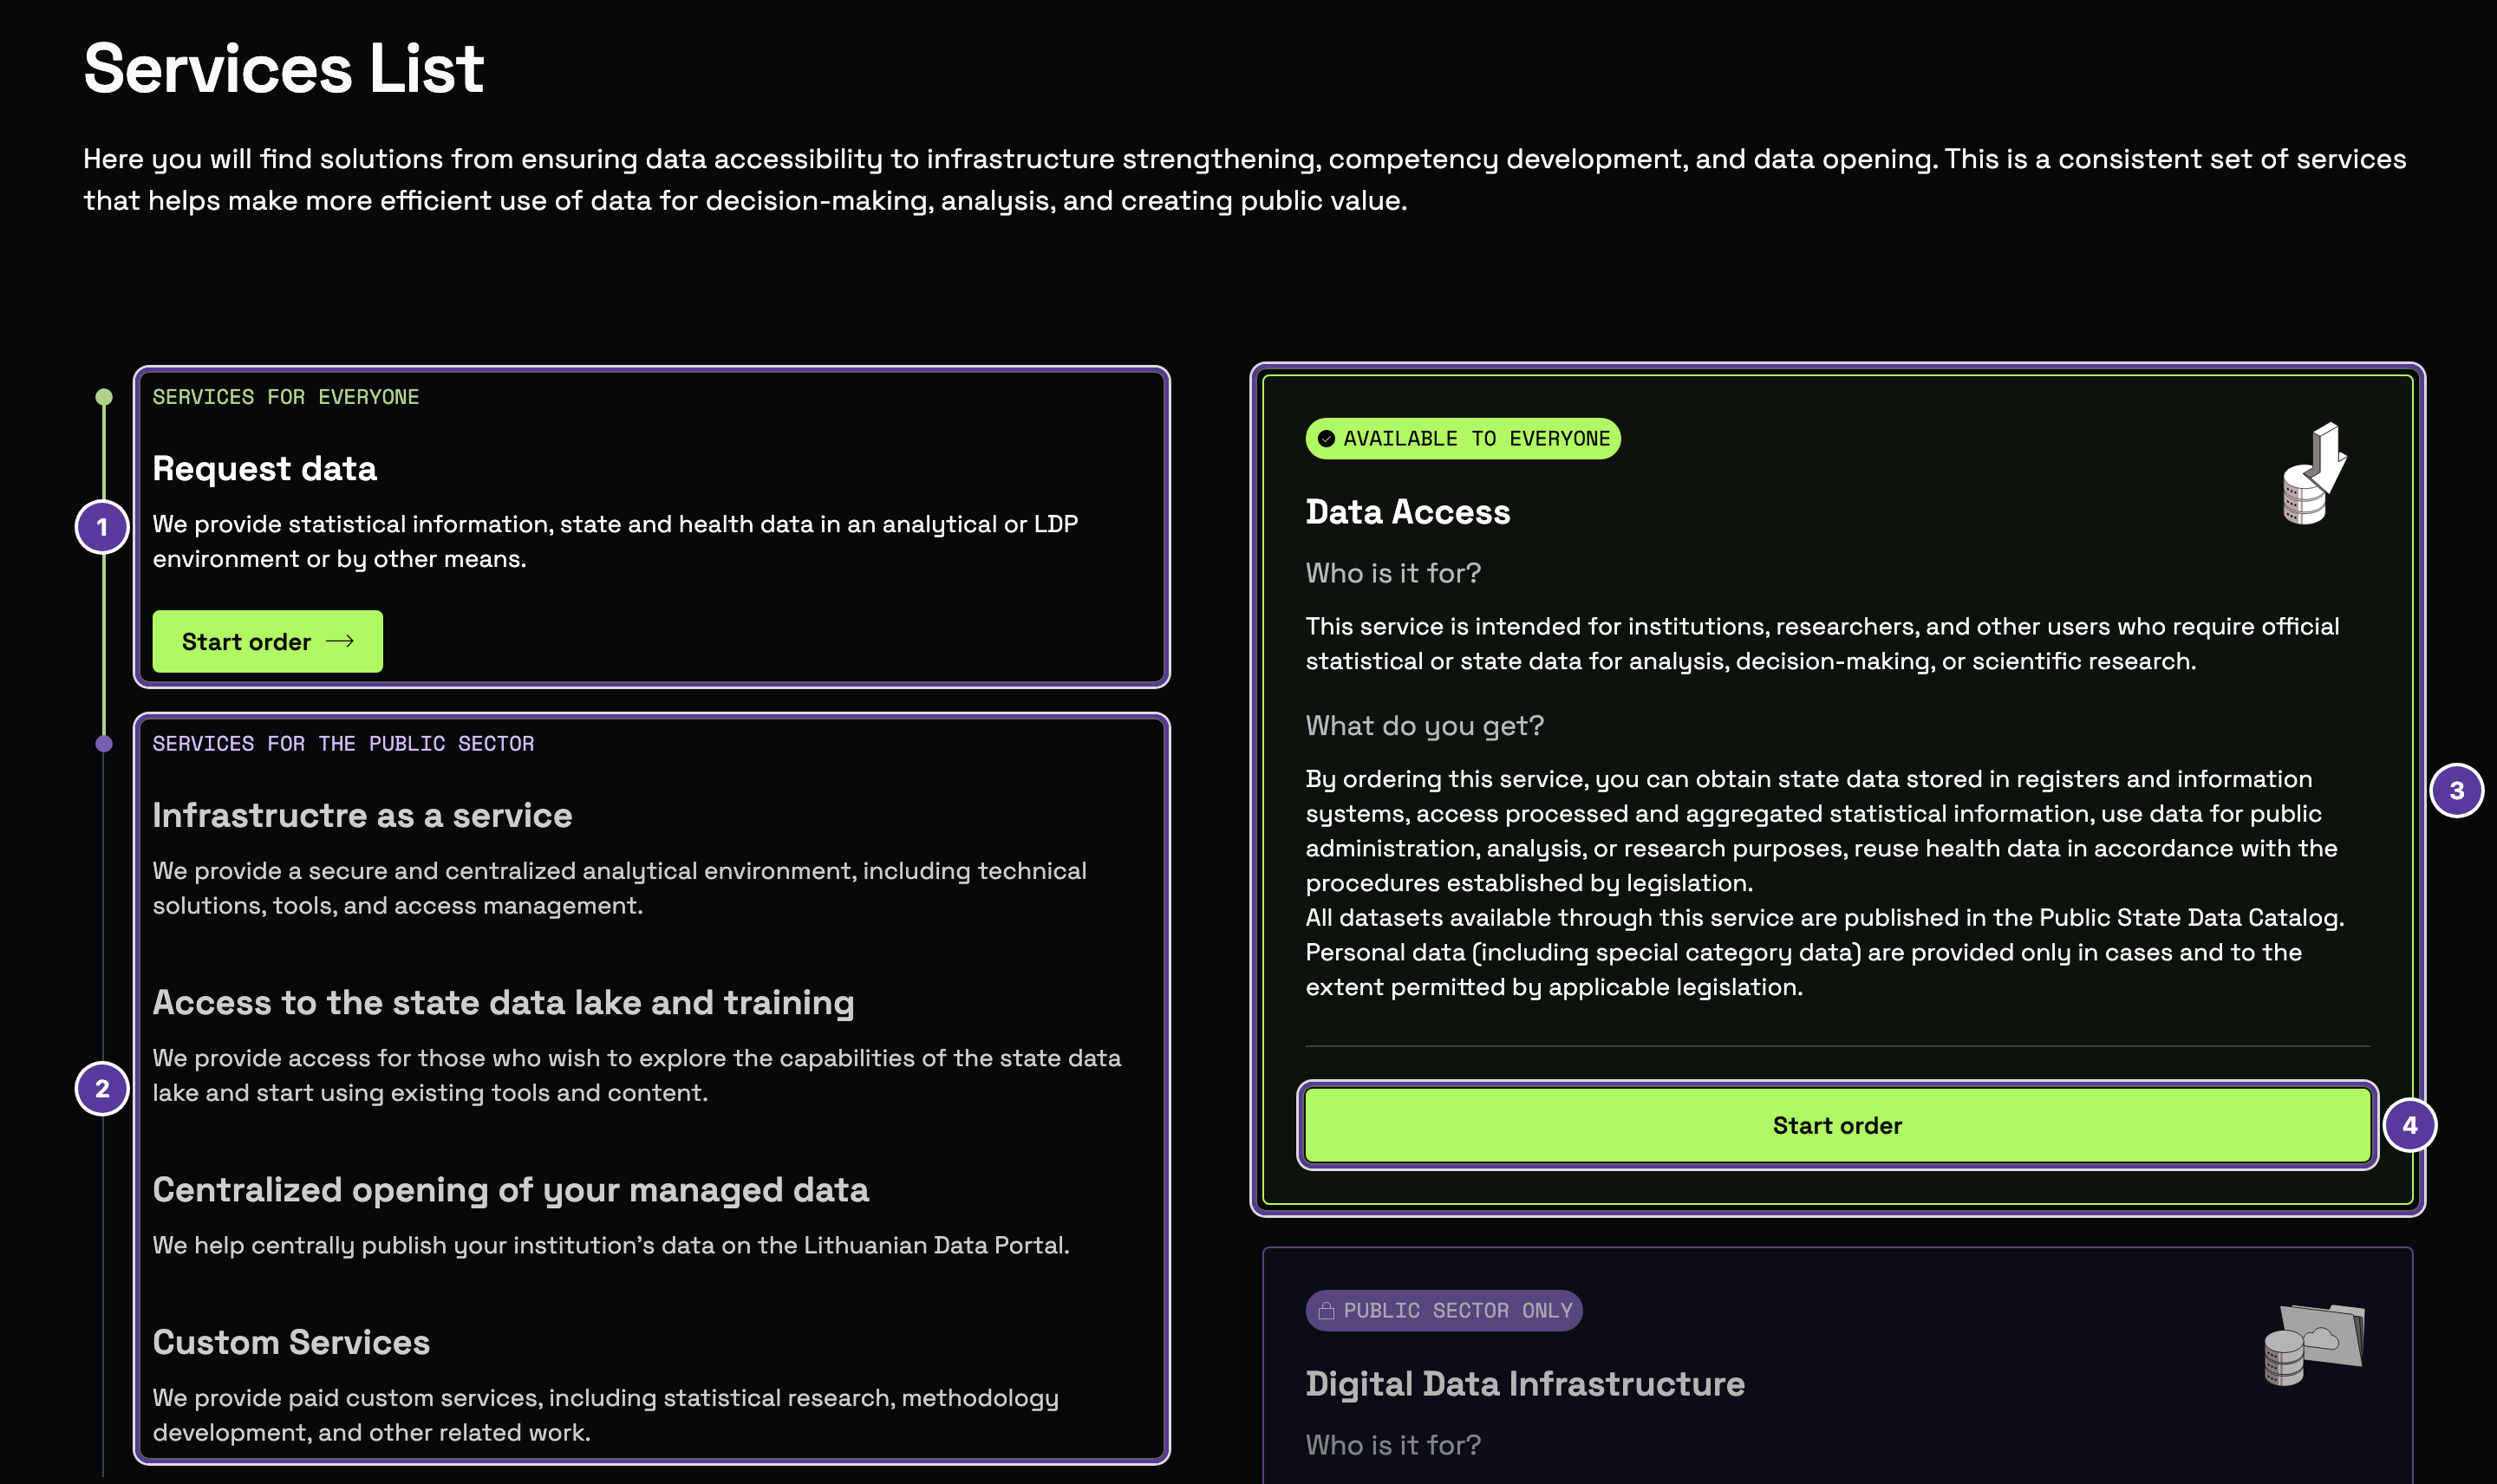
1. **Services for everyone** — requesting data. Natural and legal persons can order it.
2. **Services for the public sector** — four services for institutions only.
3. **The service card** — *Who is it for?* and *What do you get?*
4. **Start order** — active only for the data access service for now; the other services' buttons are not active yet.
| Service | Who it is for | What you get |
| ---------------------------------------------- | ------------------------------------------------ | ---------------------------------------------------------------------------------------------------------------------------------------------------------- |
| **Data Access** | Institutions, researchers and other users | Data from registers and information systems, processed statistical information, and the reuse of health data as the law provides. |
| **Digital Data Infrastructure** | Public sector only | Your information system, or part of it, on the State Data Governance Platform, with an analytical environment and tools and no infrastructure of your own. |
| **Access to the State Data Lake and Training** | Public sector only — staff and analysts | Prepared strategic indicators and dashboards, analytical tools and hands-on training. |
| **Centralized Opening of Your Managed Data** | Public sector only — institutions that hold data | The SDA inventories, prepares and publishes your open data, with metadata and automatic updates. |
| **Custom Work** | Public sector only | Paid statistical surveys, methodologies, analysis or assessments to an agreed scope and timeline. |
## How to order [#how-to-order]
### Define what you need [#define-what-you-need]
Decide what result you need (data, analysis, access or a solution), what it is for and the expected scope. If needed, consult the SDA's specialists — it shortens the coordination.
### Submit an application [#submit-an-application]
Click **Start order** and sign in:
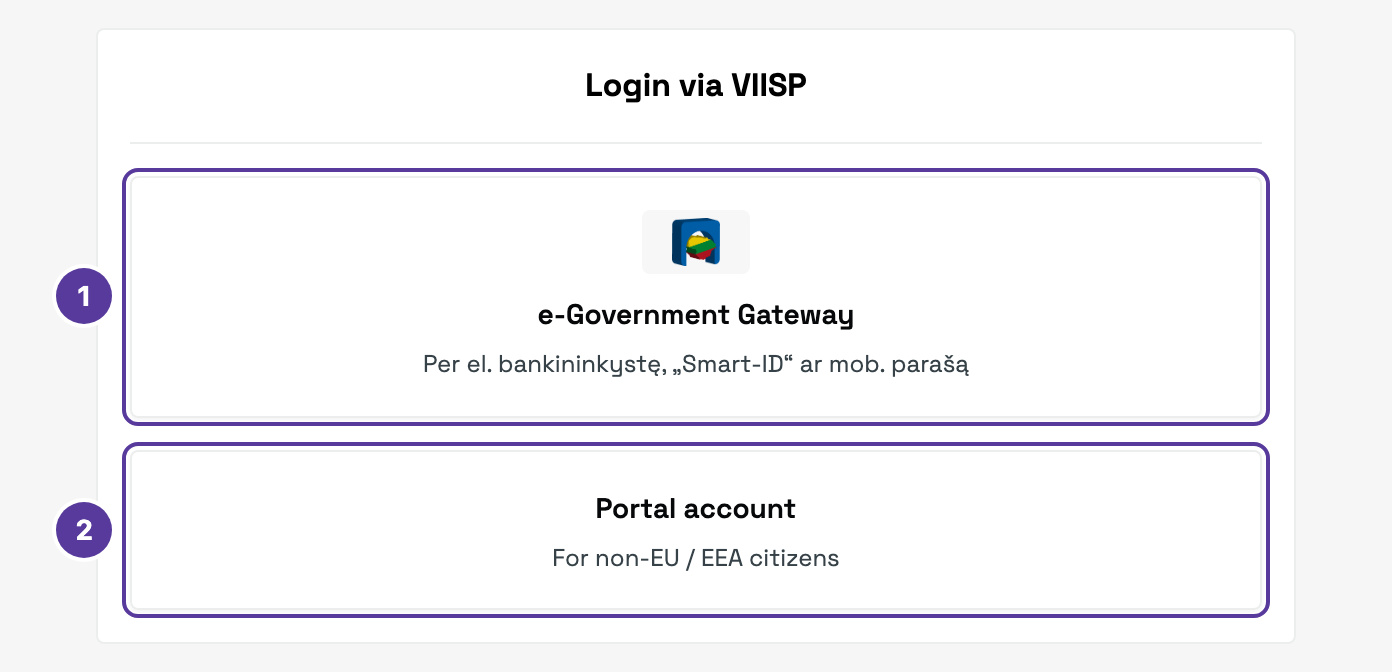
1. **e-Government Gateway** — through e-banking, Smart-ID or a mobile signature.
2. **Portal account** — for non-EU / EEA citizens.
Submitting and assessing an application is free. The SDA reviews it, clarifies how it can be delivered and tells you the expected timeline and preliminary cost.
### Agree and pay [#agree-and-pay]
The scope, terms and documents are finalised and the final price is given. Work starts only after final agreement.
### The service is delivered [#the-service-is-delivered]
The SDA prepares, cleans or anonymises the data, grants access or carries out the other agreed work.
### Receive the result [#receive-the-result]
You get access to the data or the analytical environment, or the final product — a dataset, a report or indicators.
The services are governed by the [legislation on providing statistical and state data](https://vda.lrv.lt/lt/teisine-informacija/teises-aktai/teises-aktai-pagal-sritis/teises-aktai-reglamentuojantys-statistiniu-duomenu-ir-valstybes-duomenu-teikima/) (in Lithuanian) and the SDA's [privacy policy](https://vda.lrv.lt/en/personal-data-protection/personal-data-protection-VDA/information-on-processing-of-personal-data/).
## Frequently asked questions [#frequently-asked-questions]
Yes. For statistical information, state data, confidential statistical data for scientific purposes or the reuse of health data, a prescribed application is submitted through the **Data Access** ordering module.
For statistical data only — none; the application is enough. For primary state data (data copies), attach documents showing your right to the data and the purpose of use. For more sensitive data, data security commitments may need to be signed, and sometimes a data protection impact assessment is required.
A natural or legal person, if the purpose is legitimate and there is a legal basis for obtaining the data. Applications for confidential statistical data for scientific purposes are submitted by a representative of a higher education or research institution, and the data are provided under an agreement with that institution.
The data themselves are generally free. Fees apply only to preparation and processing work when it is needed — for example, selection, linkage, certificates or analysis.
Yes, but only for preparing and administering the data, not for the data themselves.
Yes. The fee covers the application review, the data preparation work (collection, anonymisation, programming) and the use of the secure environment if the data are provided there.
For state data, usually not: an official letter setting out the scope, purpose and responsibilities is agreed instead. Confidential statistical data for scientific purposes are always provided under an agreement with the research institution.
No — the SDA is not a public procurement entity. For solutions involving state data, the SDA's centralised data management services can be commissioned instead.
The platform is for municipal administrations and related institutions. A municipal employee contacts their municipality's coordinator, who submits the request to the SDA. Other institutions and individuals apply through the **Data Access** module, stating the purpose clearly.
* **Looking for public data?** Check the [catalogue](https://guides.dataportal.gov.lt/docs/guide/browsing-data) first — open data can be [downloaded](https://guides.dataportal.gov.lt/docs/guide/browsing-data/downloading) without any order.
* **Not sure which service you need?** Consult the SDA's specialists before you apply.
# Signing in (https://guides.dataportal.gov.lt/docs/guide/account/sign-in)
## How to sign in [#how-to-sign-in]
### Click "Sign in" [#click-sign-in]
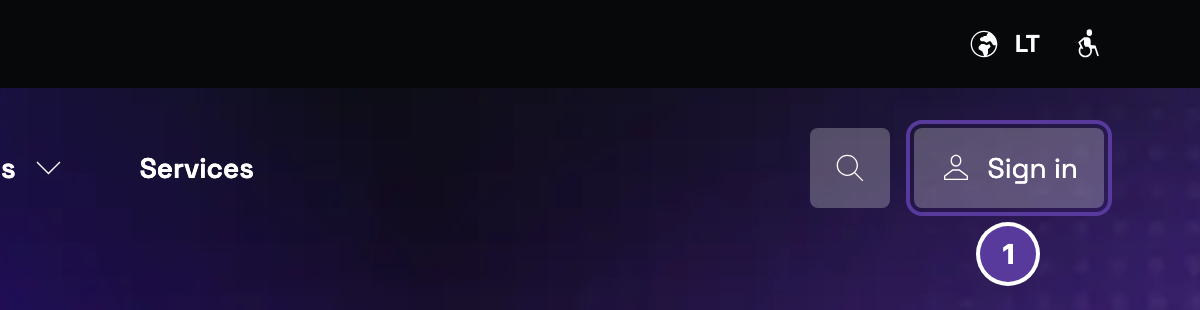
The **Sign in** button is in the top right corner of the portal.
### Choose how to sign in [#choose-how-to-sign-in]

1. **e-Government Gateway** ( *El. valdžios vartai*, VIISP) — through e-banking, Smart-ID or a mobile signature.
2. **Portal account** — for non-EU / EEA citizens.
### Confirm who you are [#confirm-who-you-are]
On the e-Government Gateway, pick how to sign in and sign in as usual. You are then taken back to the portal. The gateway opens in Lithuanian:
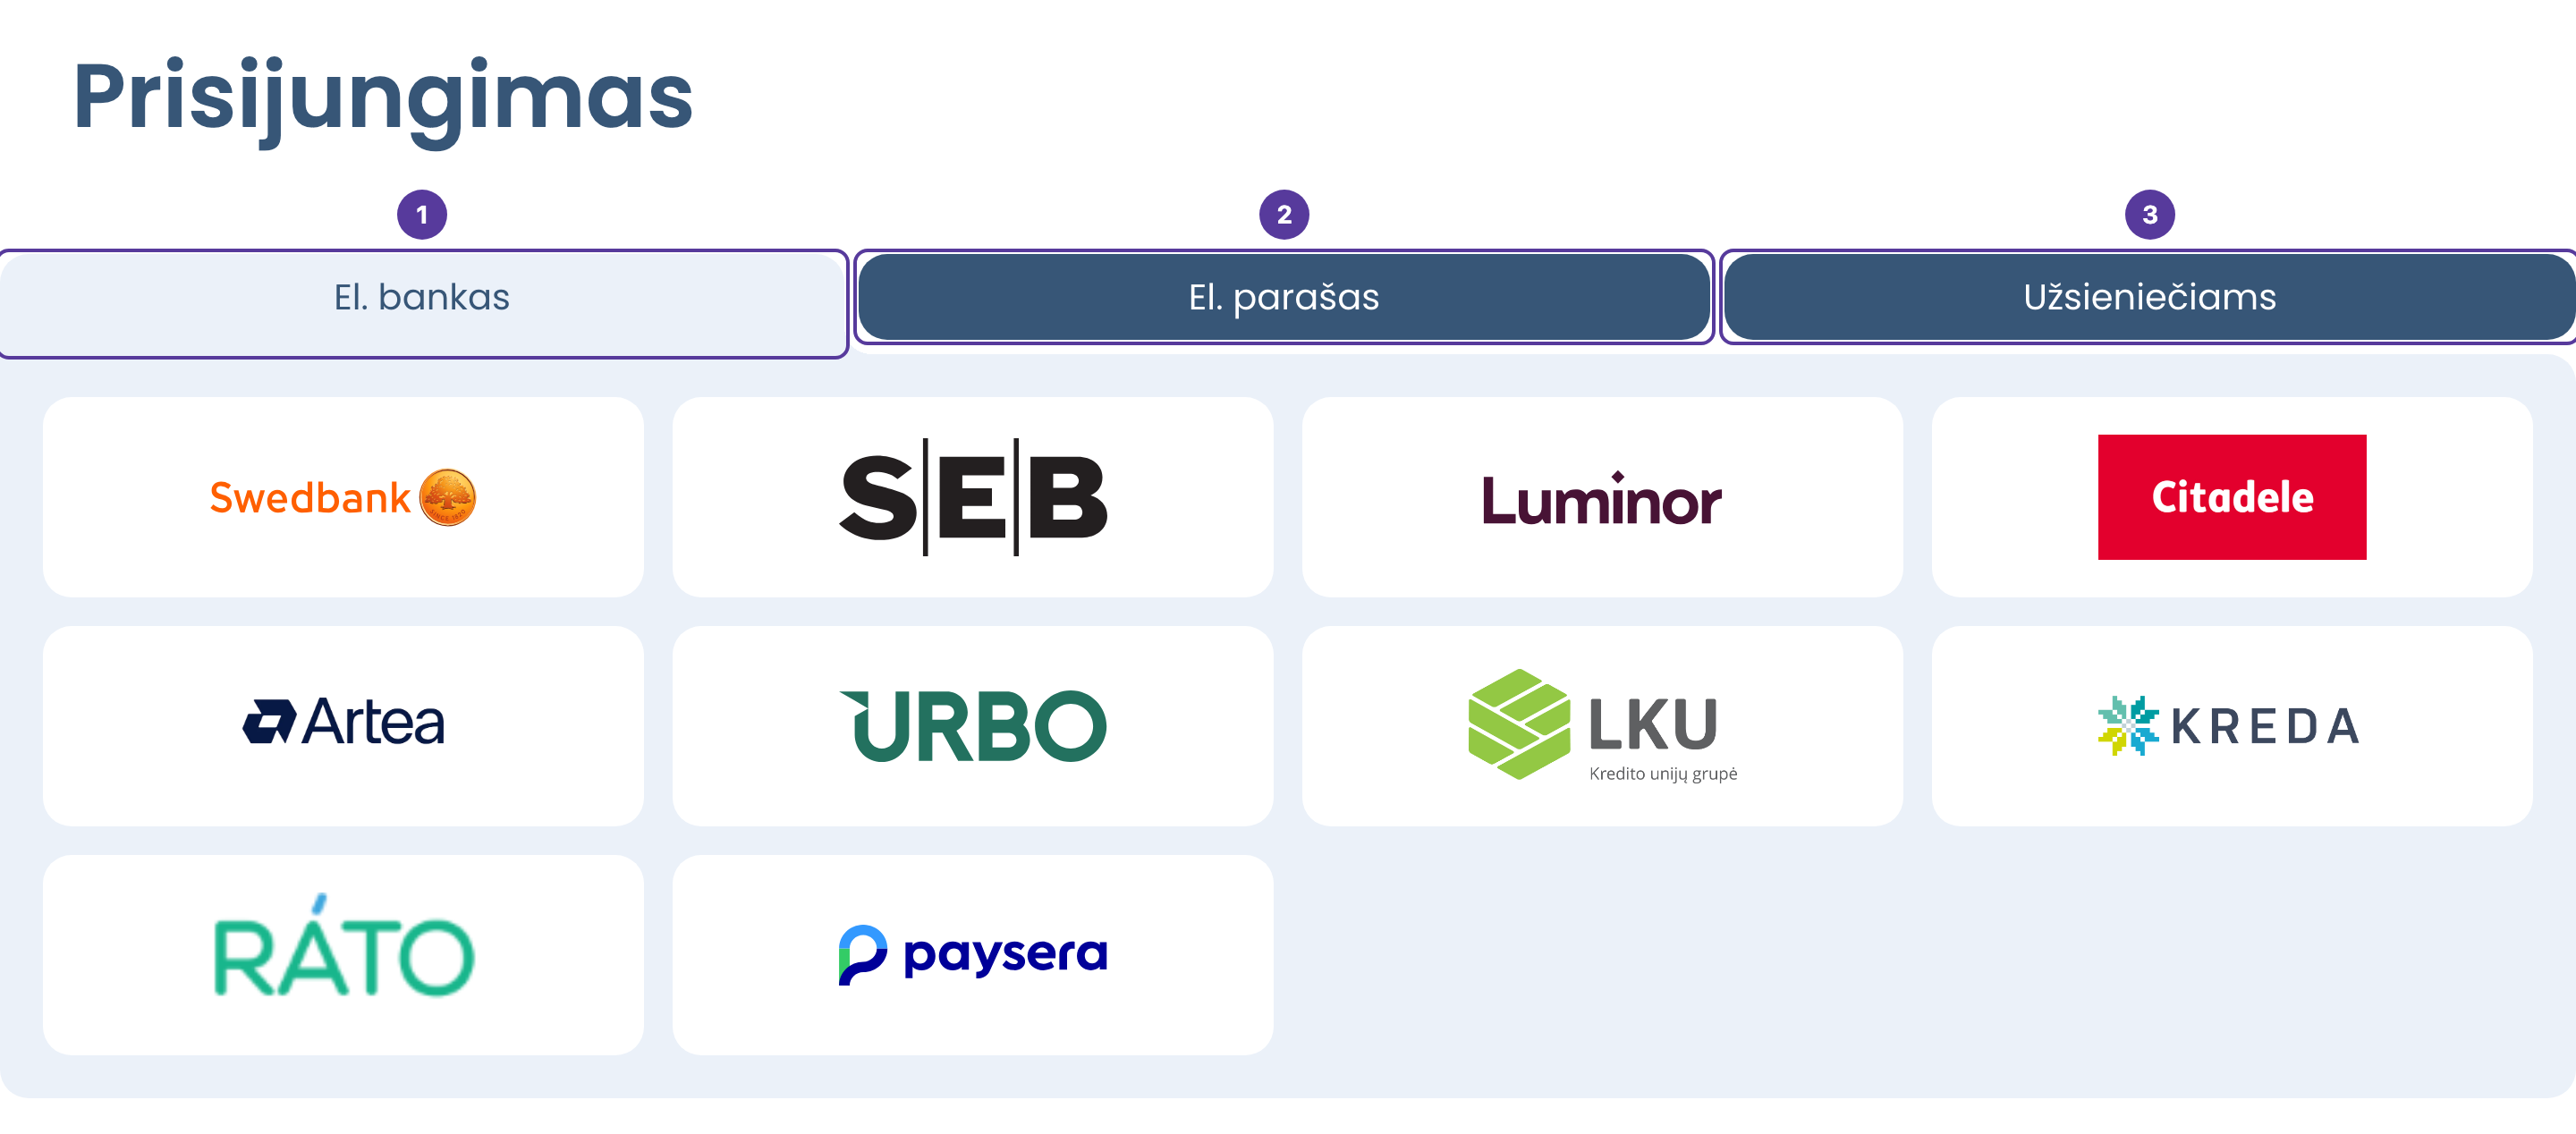
1. **El. bankas** (e-banking) — pick your bank.
2. **El. parašas** (e-signature) — Smart-ID or a mobile signature.
3. **Užsieniečiams** — for foreign nationals.
If you open an account page while signed out (for example, after your session has ended), the portal asks you to sign in first and then takes you back to the same page.
## Your first sign-in [#your-first-sign-in]
The first time you sign in, the portal asks you to finish your profile in two steps. They are not repeated: after that, the e-Government Gateway takes you straight back to the portal.
{/* TODO(en-ui): the first-sign-in steps were only seen in Lithuanian — check their English labels. */}
### Profile information [#profile-information]
Your **first name** and **last name** come from the e-Government Gateway and cannot be changed. Enter your **email** (required) and, if you like, a **phone number** with its country code. Click **Save** — a confirmation code is sent to that address straight away.
### Email confirmation [#email-confirmation]
Enter the six-character **code** from the email and click **Continue**. Your account opens.
* No email? Wait up to 5 minutes and check your spam folder.
* Code wrong or expired? Click **Send the code again**.
* Mistyped your email? Click **Back** and correct it.
## Signing out [#signing-out]
Click your name in the top right corner and choose **Log out**.
## Frequently asked questions [#frequently-asked-questions]
An email address is required. A phone number is optional.
It makes sure the address is valid and reaches you. The confirmation code is sent as soon as you save your contact details.
Up to 5 minutes. If it still hasn't arrived, check your spam folder.
Click **Send the code again** — a new code is sent to the same address.
No. You fill in your profile and confirm your email only the first time. After that, the e-Government Gateway takes you straight back to the portal.
# Your account (https://guides.dataportal.gov.lt/docs/guide/account)
You can browse and download data without signing in. Signed in, you can also **favourite** datasets, **save** tables and get **notifications** when they are updated, **order services** and keep track of their payments. To sign in, see [Signing in](https://guides.dataportal.gov.lt/docs/guide/account/sign-in).
To open your account, click your name in the top right corner. The same menu has **Log out**. On the account pages, the sections are listed on the left.
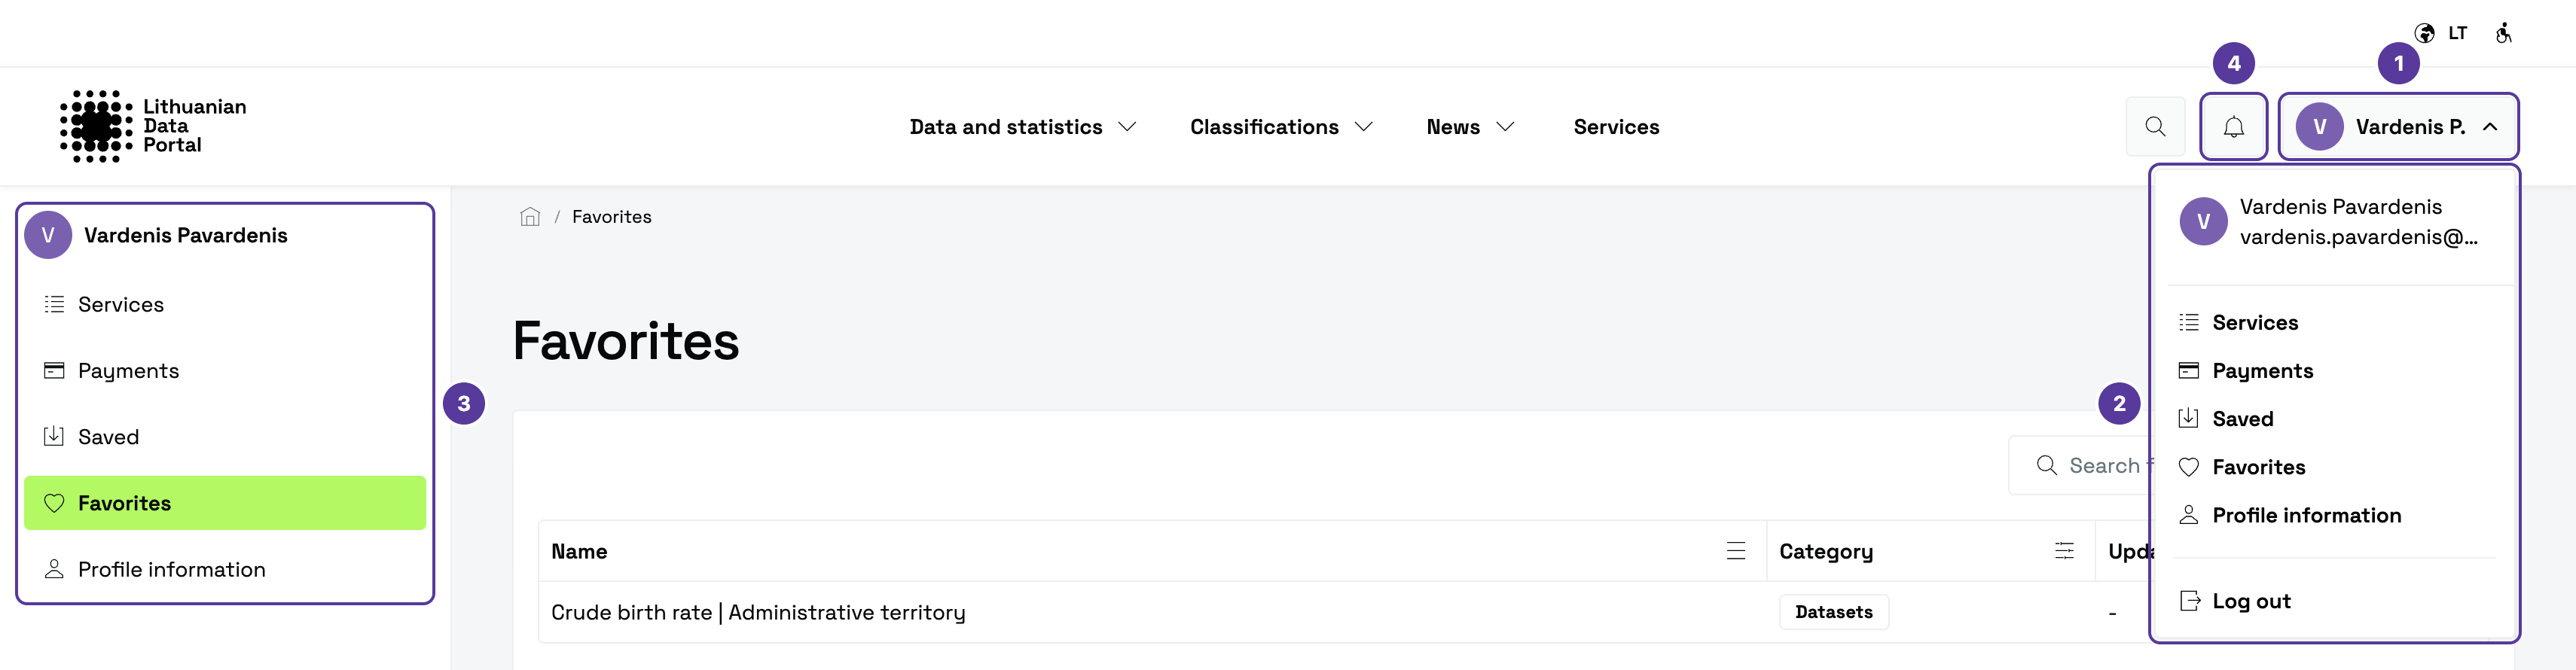
1. **Your name** — click it to open the account menu.
2. **The account menu** — the sections and **Log out**.
3. **The list of sections** — on the left of every account page.
4. **The bell** — opens **Notifications**.
## Sections [#sections]
# Favourites and saved tables (https://guides.dataportal.gov.lt/docs/guide/account/saved-data)
## Favourite a dataset [#favourite-a-dataset]
On a dataset page, in the panel on the right, click the heart — **Add to favorites**. The heart turns red and the dataset appears under **Favorites**. Click it again — **Remove from favorites** — to remove it.
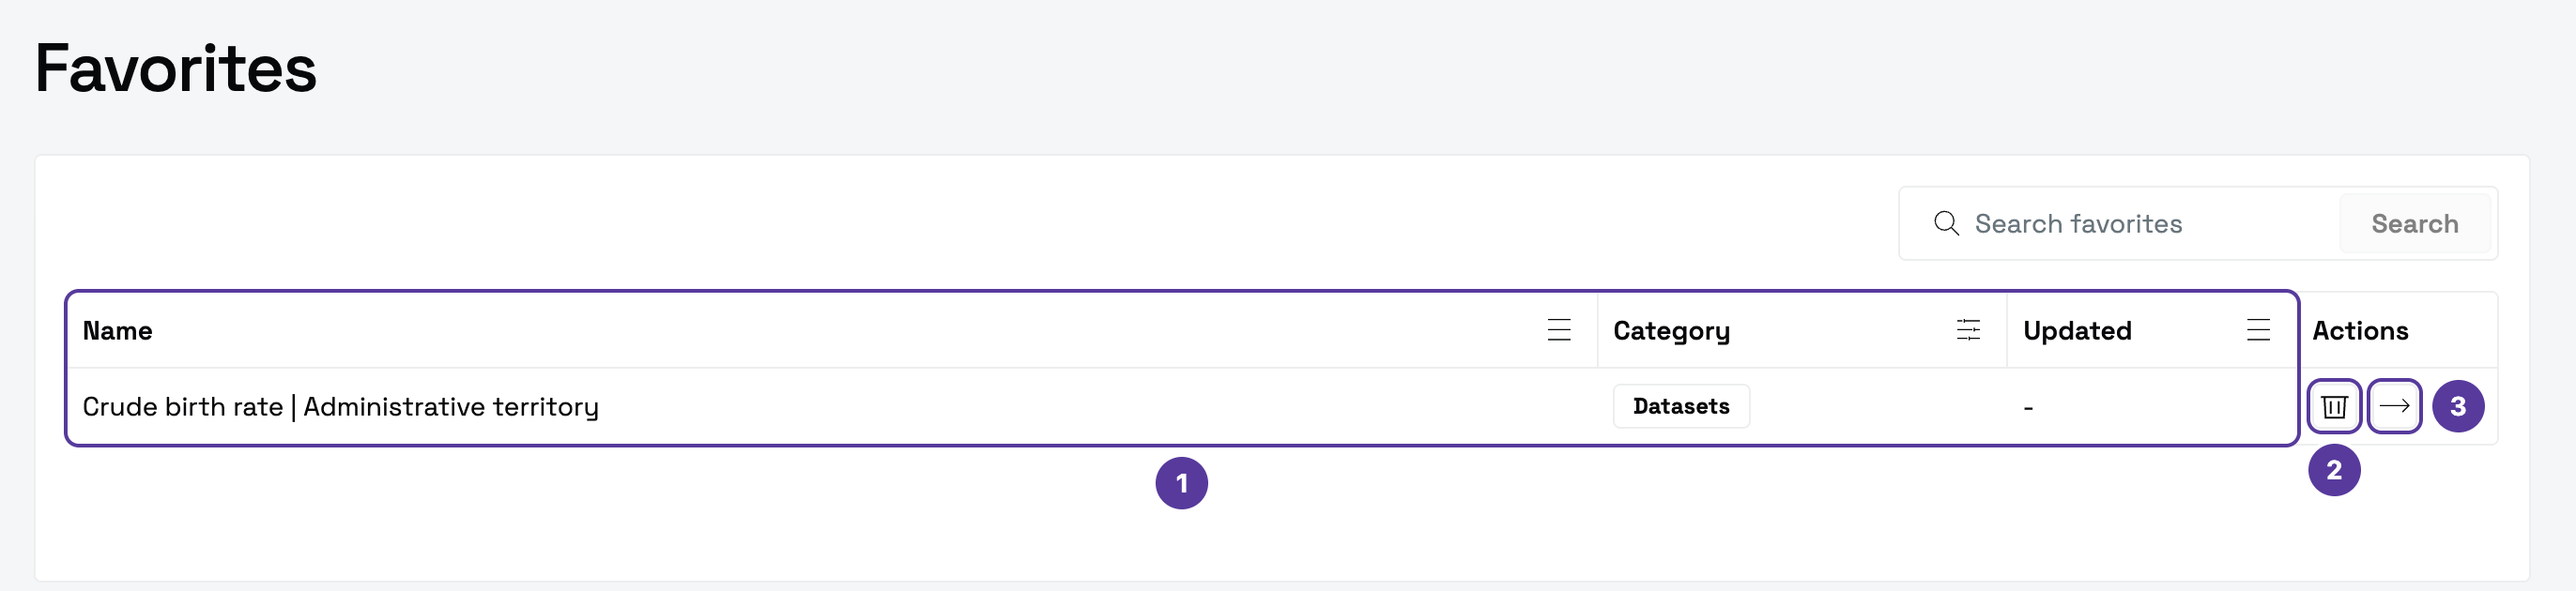
1. **Name, Category, Updated** — sort and filter the list by these columns.
2. **Remove from favorites** — the portal asks you to confirm. Only the entry in your list is removed; the dataset stays on the portal.
3. **Open** — opens the dataset page.
## Save a table [#save-a-table]
A favourite is just a bookmark. A saved table does more: you can keep it in a folder, keep it updated automatically and get an email when the data changes.
### Open the table and click "Save" [#open-the-table-and-click-save]
On a dataset page, in the **Table** tab, the **Save** button sits next to **Columns** and **Filters**.
### Fill in the save form [#fill-in-the-save-form]
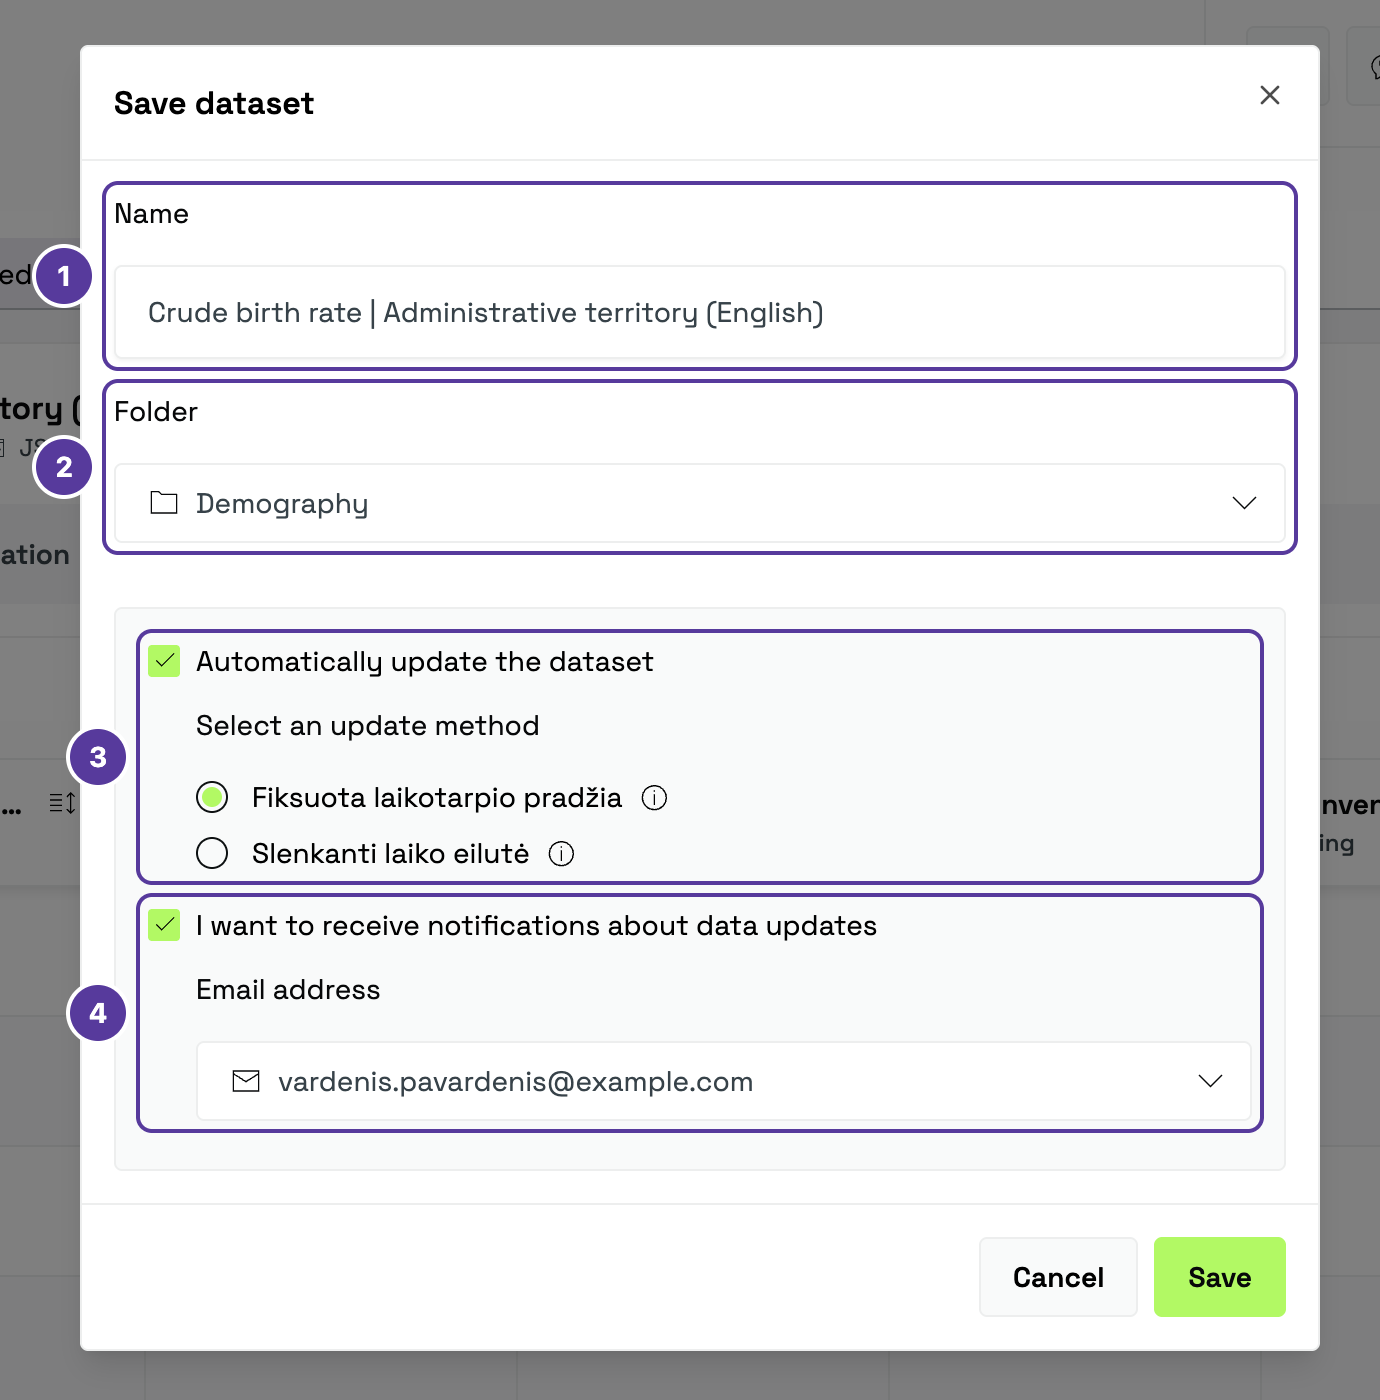
1. **Name** — filled in with the table's name; you can change it.
2. **Folder** — pick an existing folder or create a new one and name it.
3. **Automatically update the dataset** — ticked by default. Choose how it updates (see the table below).
4. **I want to receive notifications about data updates** — ticked by default; choose the **Email address**. Untick it and no emails are sent.
The two update methods are shown in Lithuanian on the English site as well:
| Update method | What happens | Example: saved with 2020–2024 |
| -------------------------------------------------------- | ----------------------------------------------------------------------------------- | ------------------------------------------ |
| **Fiksuota laikotarpio pradžia** — fixed start (default) | The start date stays the same; newer data keeps being added from it. | When 2025 data arrives, you see 2020–2025. |
| **Slenkanti laiko eilutė** — rolling window | The length of the period stays the same; the oldest data is replaced by newer data. | When 2025 data arrives, you see 2021–2025. |
### Click "Save" [#click-save]
The portal confirms that the dataset was saved, with a link straight to **Saved**.
## The "Saved" section [#the-saved-section]
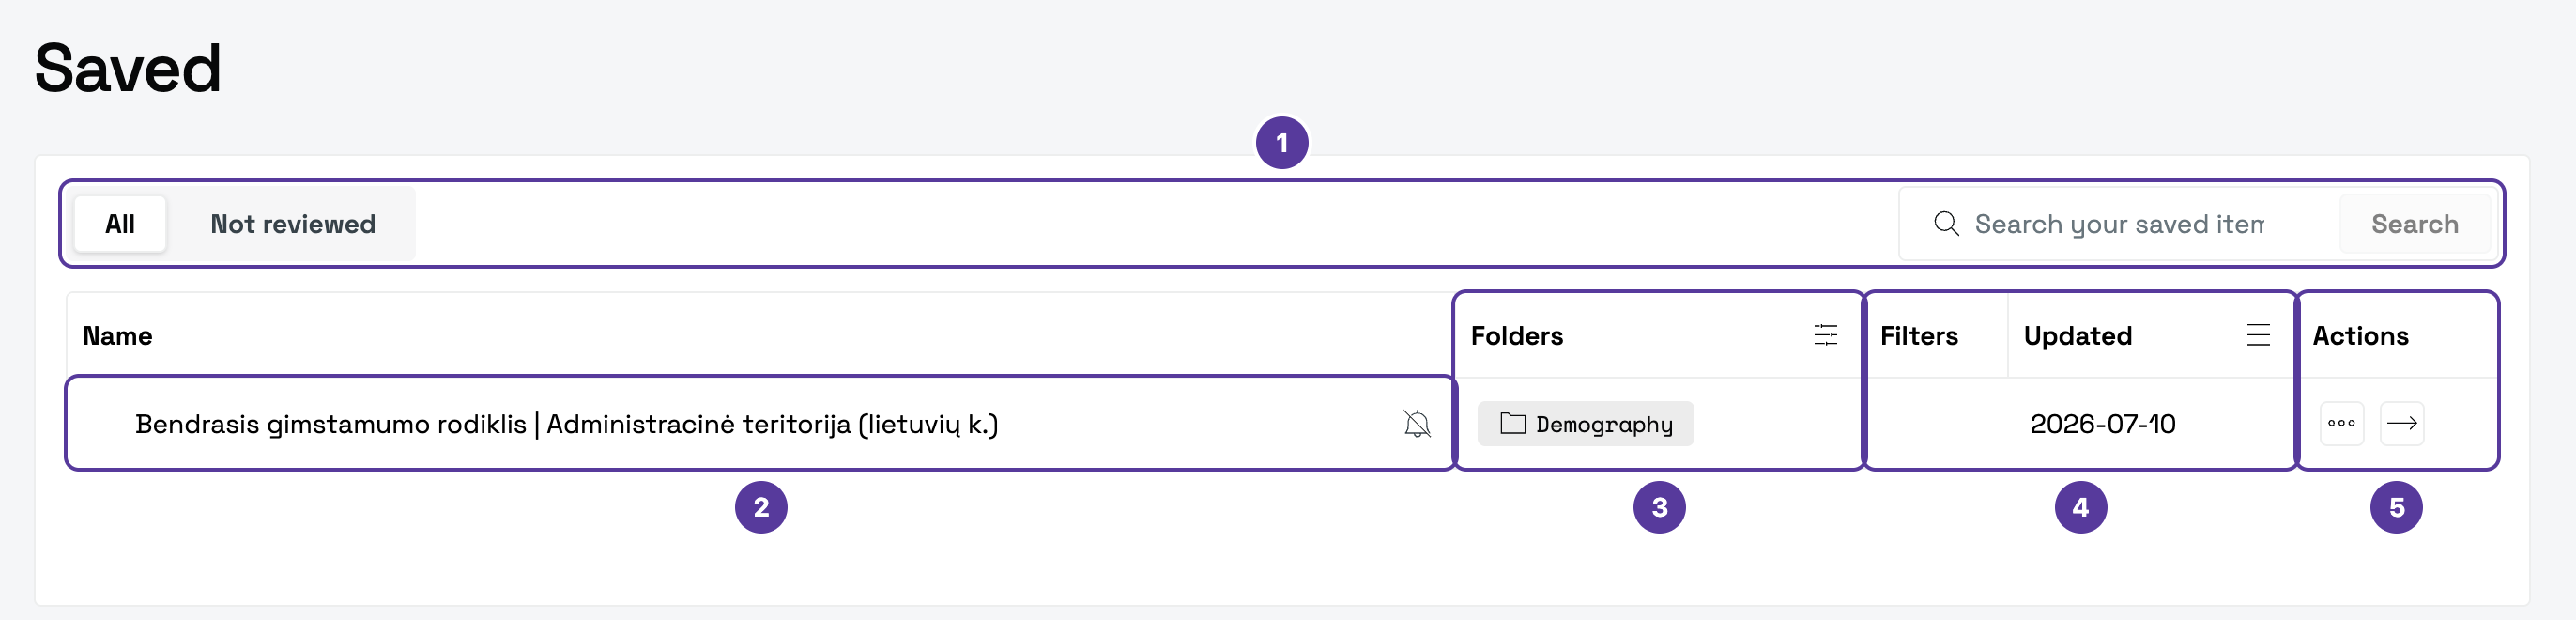
1. **All** and **Not reviewed** — the list's tabs; plus a search box.
2. **Name** — a crossed-out bell next to it means update notifications are off.
3. **Folders** — sort the list by folder (A–Z, Z–A) or filter it: tick folders and apply.
4. **Filters** and **Updated** — the table's filters and the date the data was last updated.
5. **Actions** — the **⋯** menu: **Turn on subscription** (emails about updates) and **Remove**; the **Open** arrow opens the dataset.
Before removing an entry, the portal asks you to confirm — **Remove saved dataset?** Only the entry in your list is removed — the original data stays on the portal.
* **Want emails about updates?** When saving a table, leave **I want to receive notifications about data updates** ticked. For a table you've already saved, turn them on under **Saved**: **⋯** → **Turn on subscription**.
* **Folders stay.** When you remove the last entry from a folder, the folder is still listed — you can pick it again next time you save.
# Notifications (https://guides.dataportal.gov.lt/docs/guide/account/notifications)
The bell in the top right corner opens **Notifications** — portal notifications addressed to you.
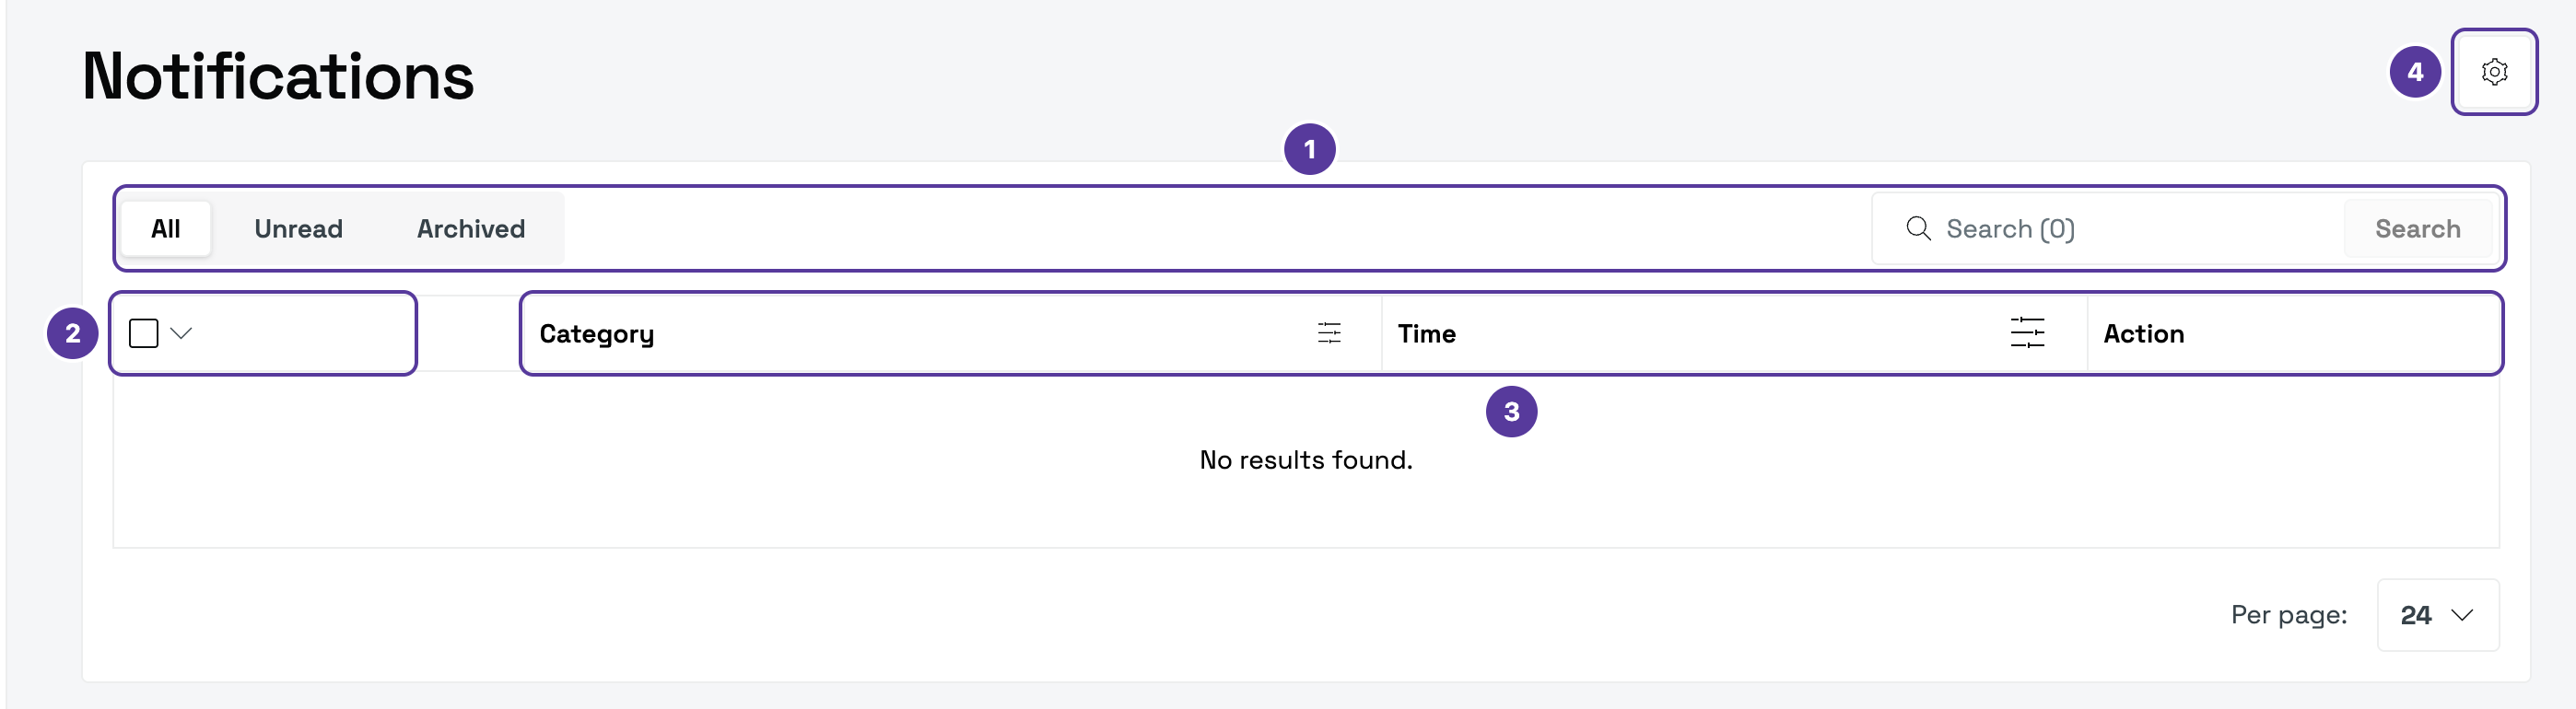
1. **All**, **Unread** and **Archived** — the list's tabs; search next to them.
2. **The checkbox** — select several notifications at once: **All**, **None**, **Read** or **Unread**.
3. **Category**, **Time** and **Action** — filter the list by category and sort it by time.
4. **Notification settings** — the gear in the top right.
## Notification settings [#notification-settings]
Here you choose which **emails** you get. Each notification type has its own switch.
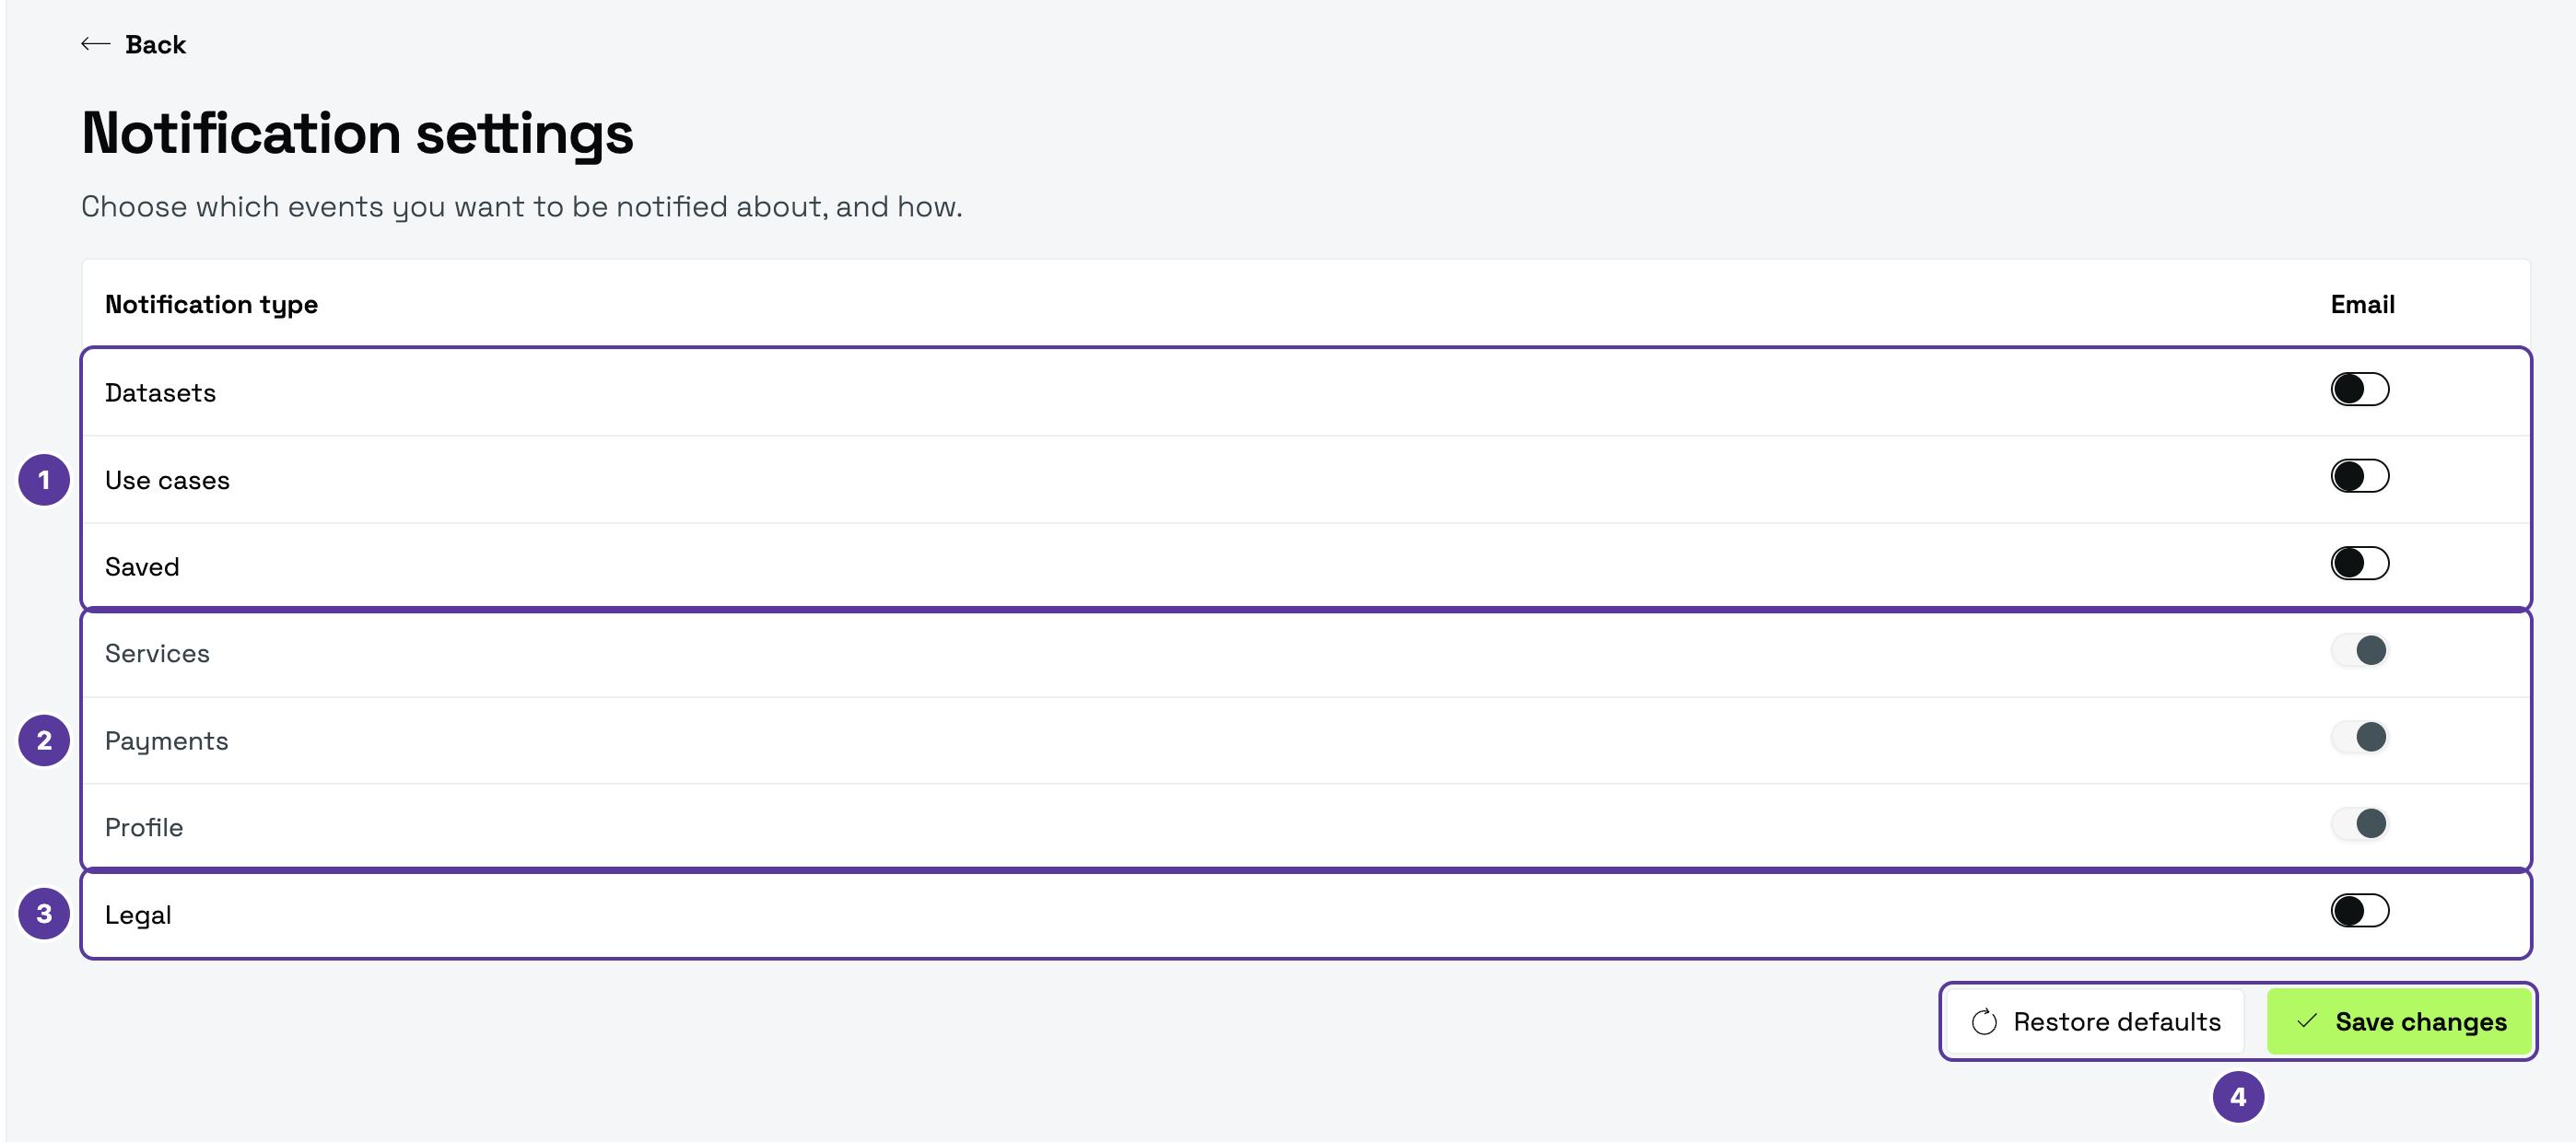
1. **Datasets**, **Use cases**, **Saved** — off at first; you can turn them on.
2. **Services**, **Payments**, **Profile** — always on: these notifications are mandatory and cannot be turned off.
3. **Legal** — off at first; you can turn it on.
4. **Save changes** saves your choices; **Restore defaults** brings back the original settings.
# Service orders and payments (https://guides.dataportal.gov.lt/docs/guide/account/orders)
Under **Services** you see your [service](https://guides.dataportal.gov.lt/docs/guide/services) applications:
* **Submitted applications** — sent to the State Data Agency.
* **Draft applications** — drafts you saved before finishing.
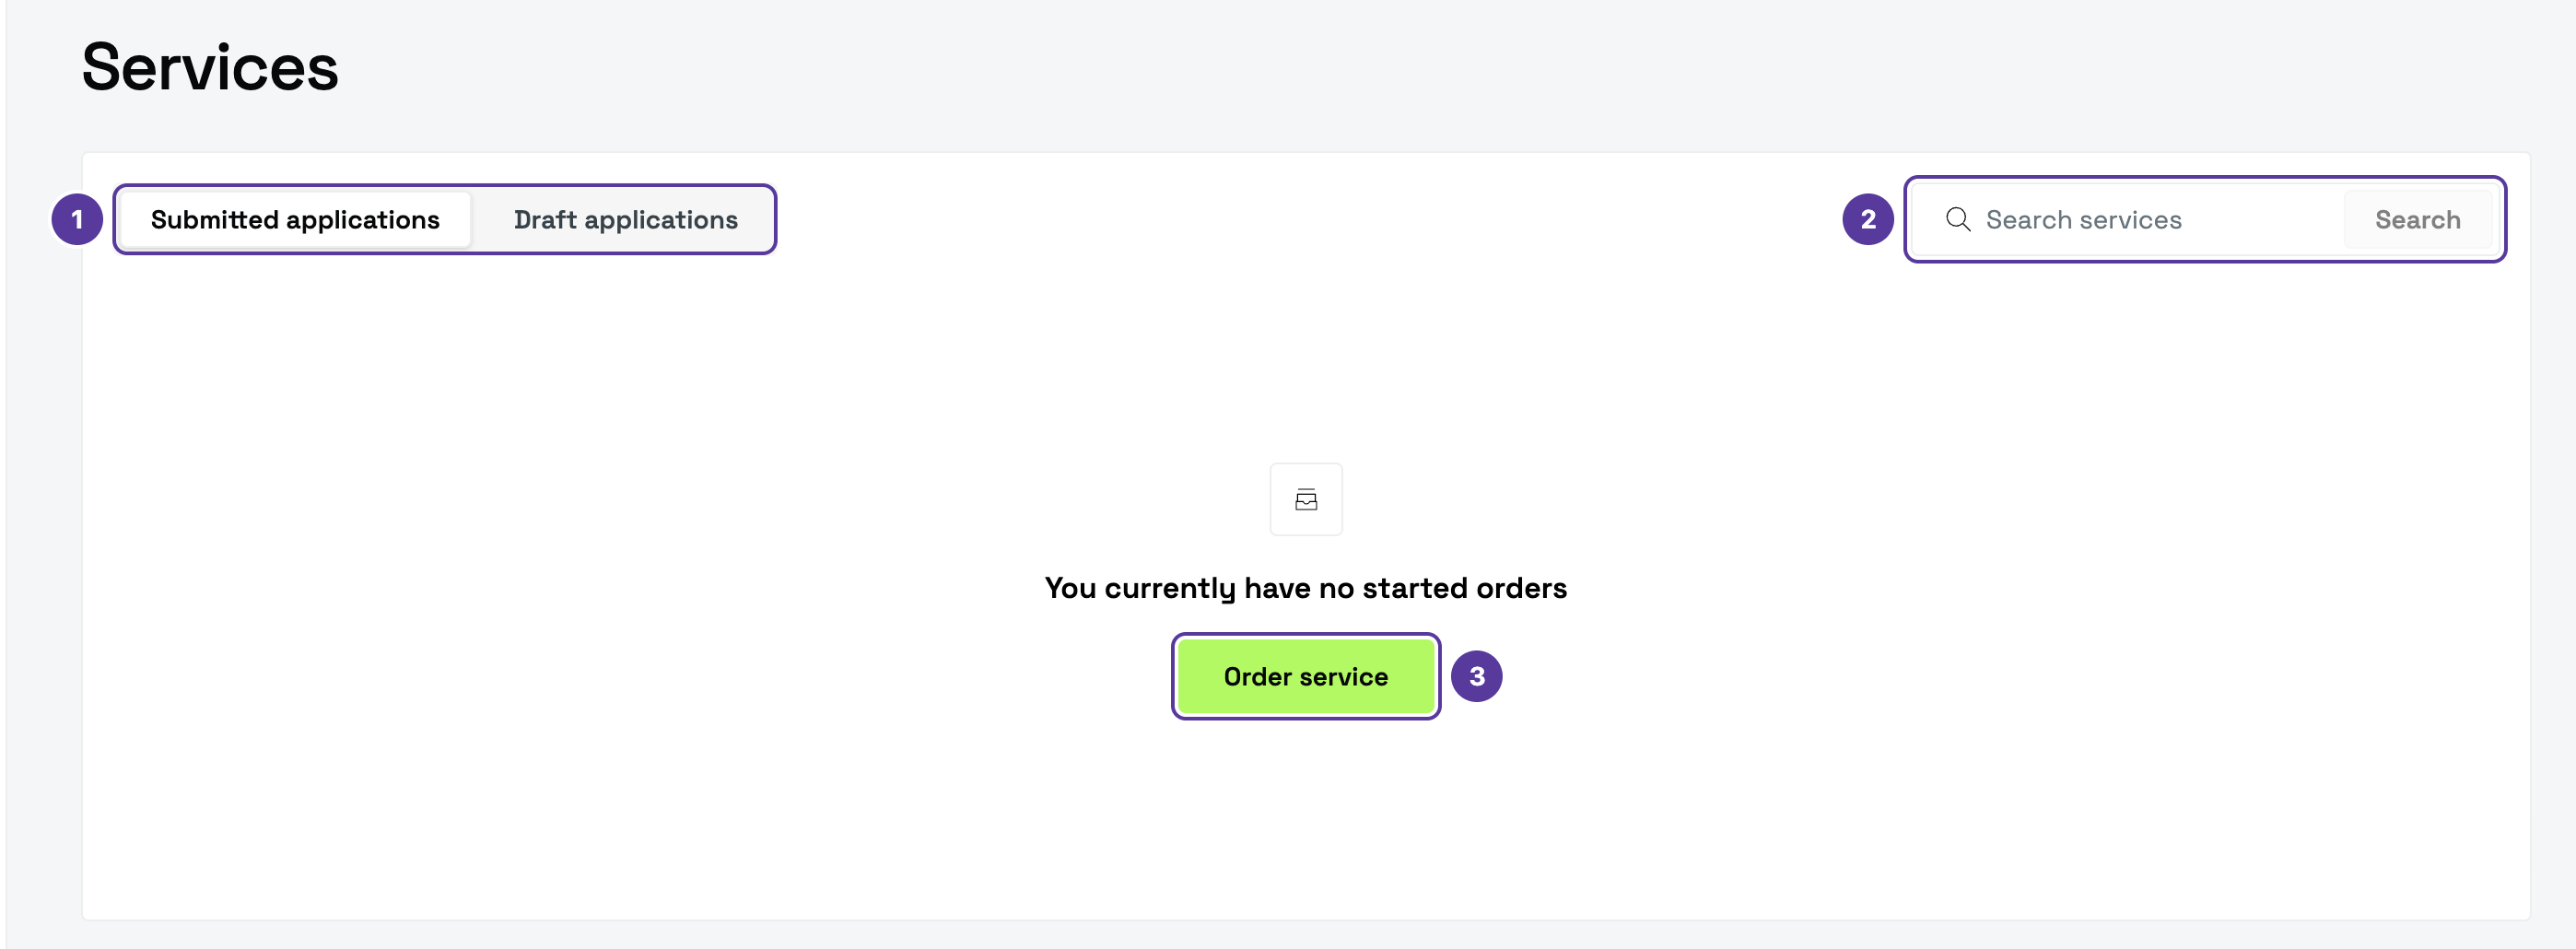
1. **Submitted applications** and **Draft applications** — the list's tabs.
2. **Search services** — search your applications.
3. **Order service** — opens the order form.
## The order form [#the-order-form]
**Order service** opens the order form:
### Service requester [#service-requester]
Choose who is ordering:
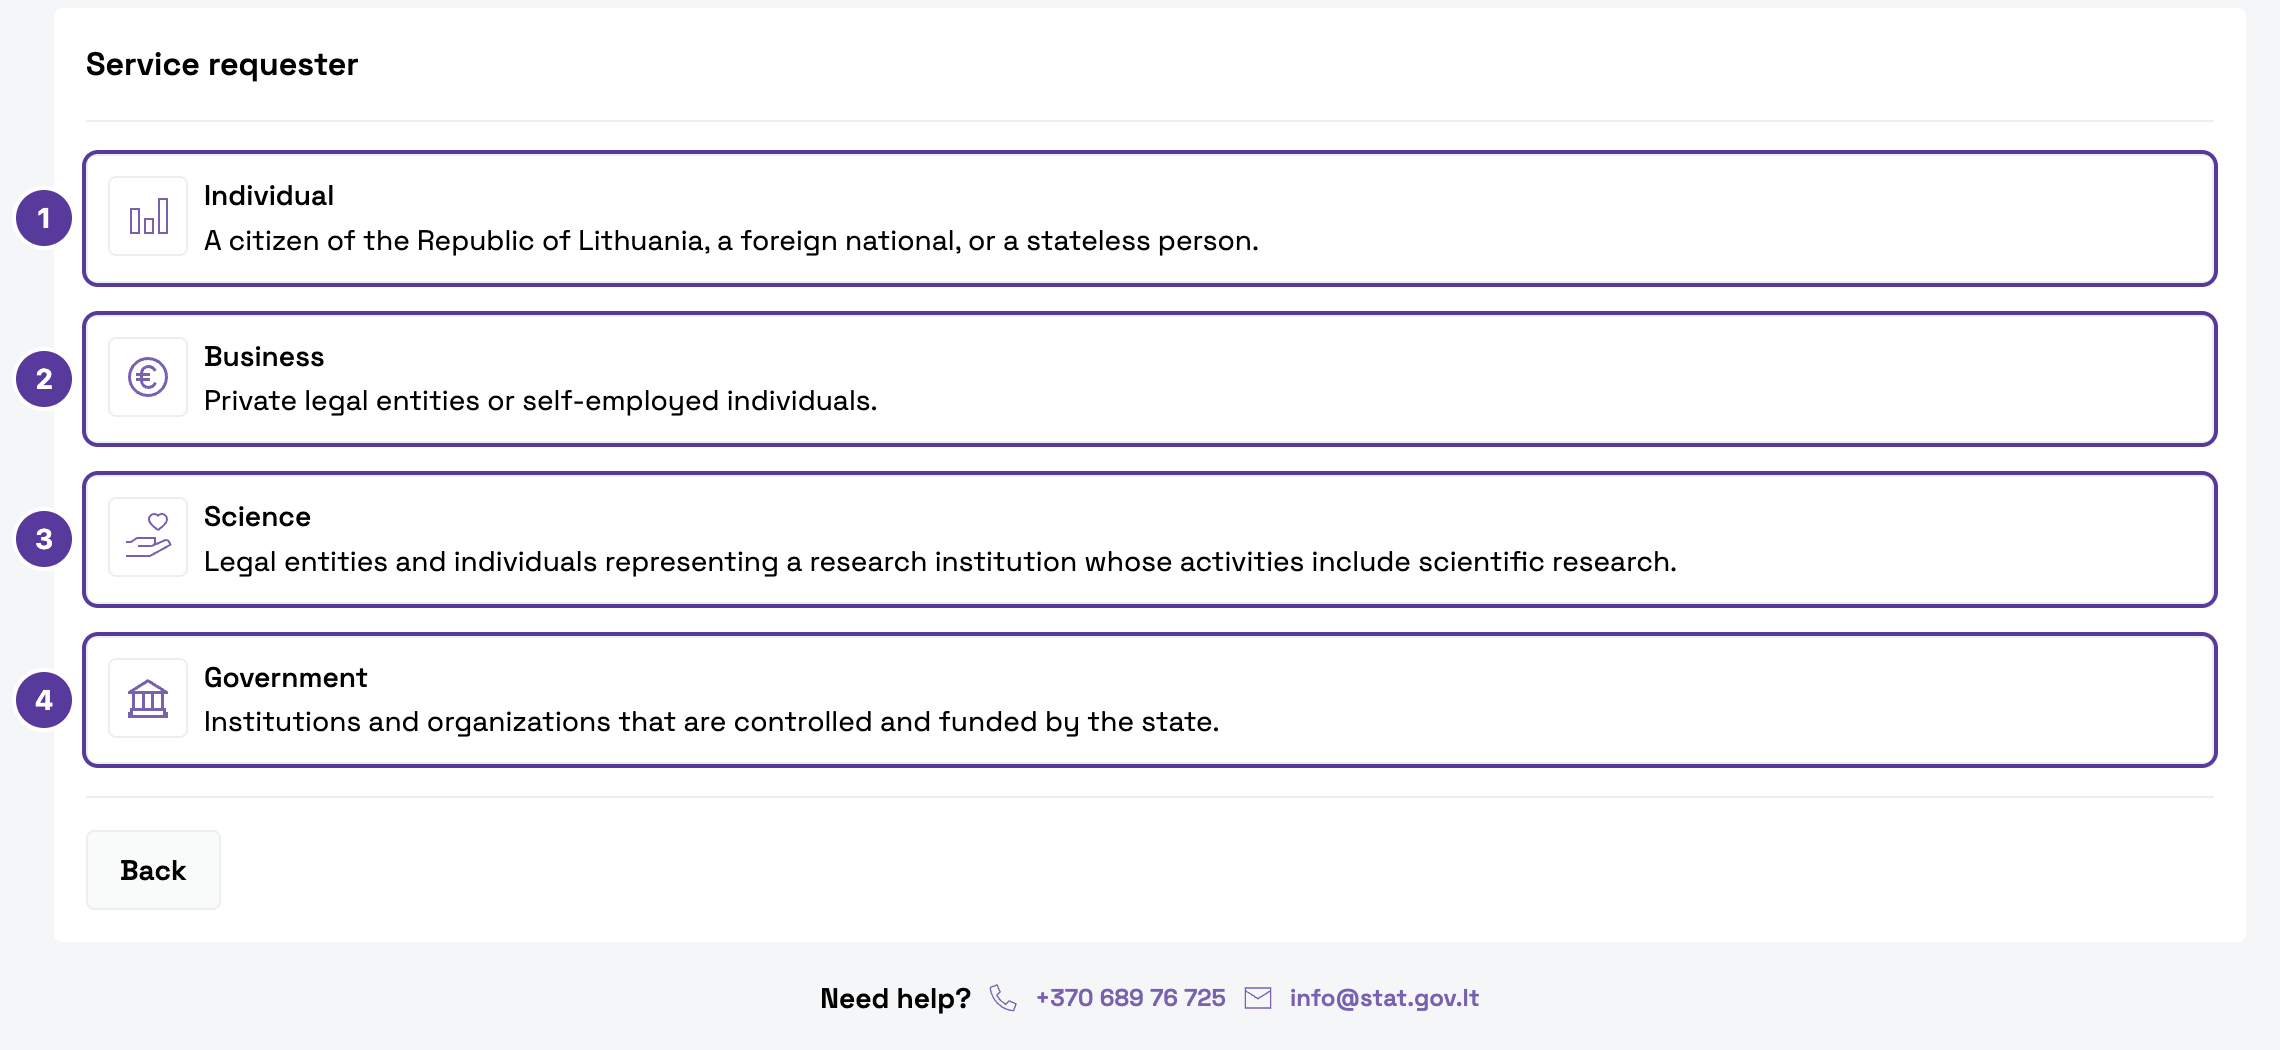
1. **Individual** — a citizen of the Republic of Lithuania, a foreign national or a stateless person.
2. **Business** — private legal entities or self-employed individuals.
3. **Science** — people representing a research institution.
4. **Government** — institutions and organisations controlled and funded by the state.
### Service [#service]
Choose the service. Which ones are available depends on the requester: an individual can only choose **Request data**. To change your first choice, click the pencil next to it.
### Requested data [#requested-data]
Choose the **Data type** (statistical and/or administrative data, or health data) and describe what you need (up to 2000 characters). Click **Continue**, or **Save draft and close** — the draft appears under **Draft applications**.
What happens after you submit is described on the [Services](https://guides.dataportal.gov.lt/docs/guide/services#how-to-order) page. For help with ordering: **+370 689 76 725**, **[info@stat.gov.lt](mailto:info@stat.gov.lt)**.
## Payments [#payments]
**Payments** lists your pending and completed payments for services: **Order No.**, **Service Title**, **Payment Status** and **Order Date**. You can search and sort the list; filters appear once there are payments.
# Profile and sign-in history (https://guides.dataportal.gov.lt/docs/guide/account/profile)
Under **Profile information** you can change your contact details and see when and from where your account was signed in to.
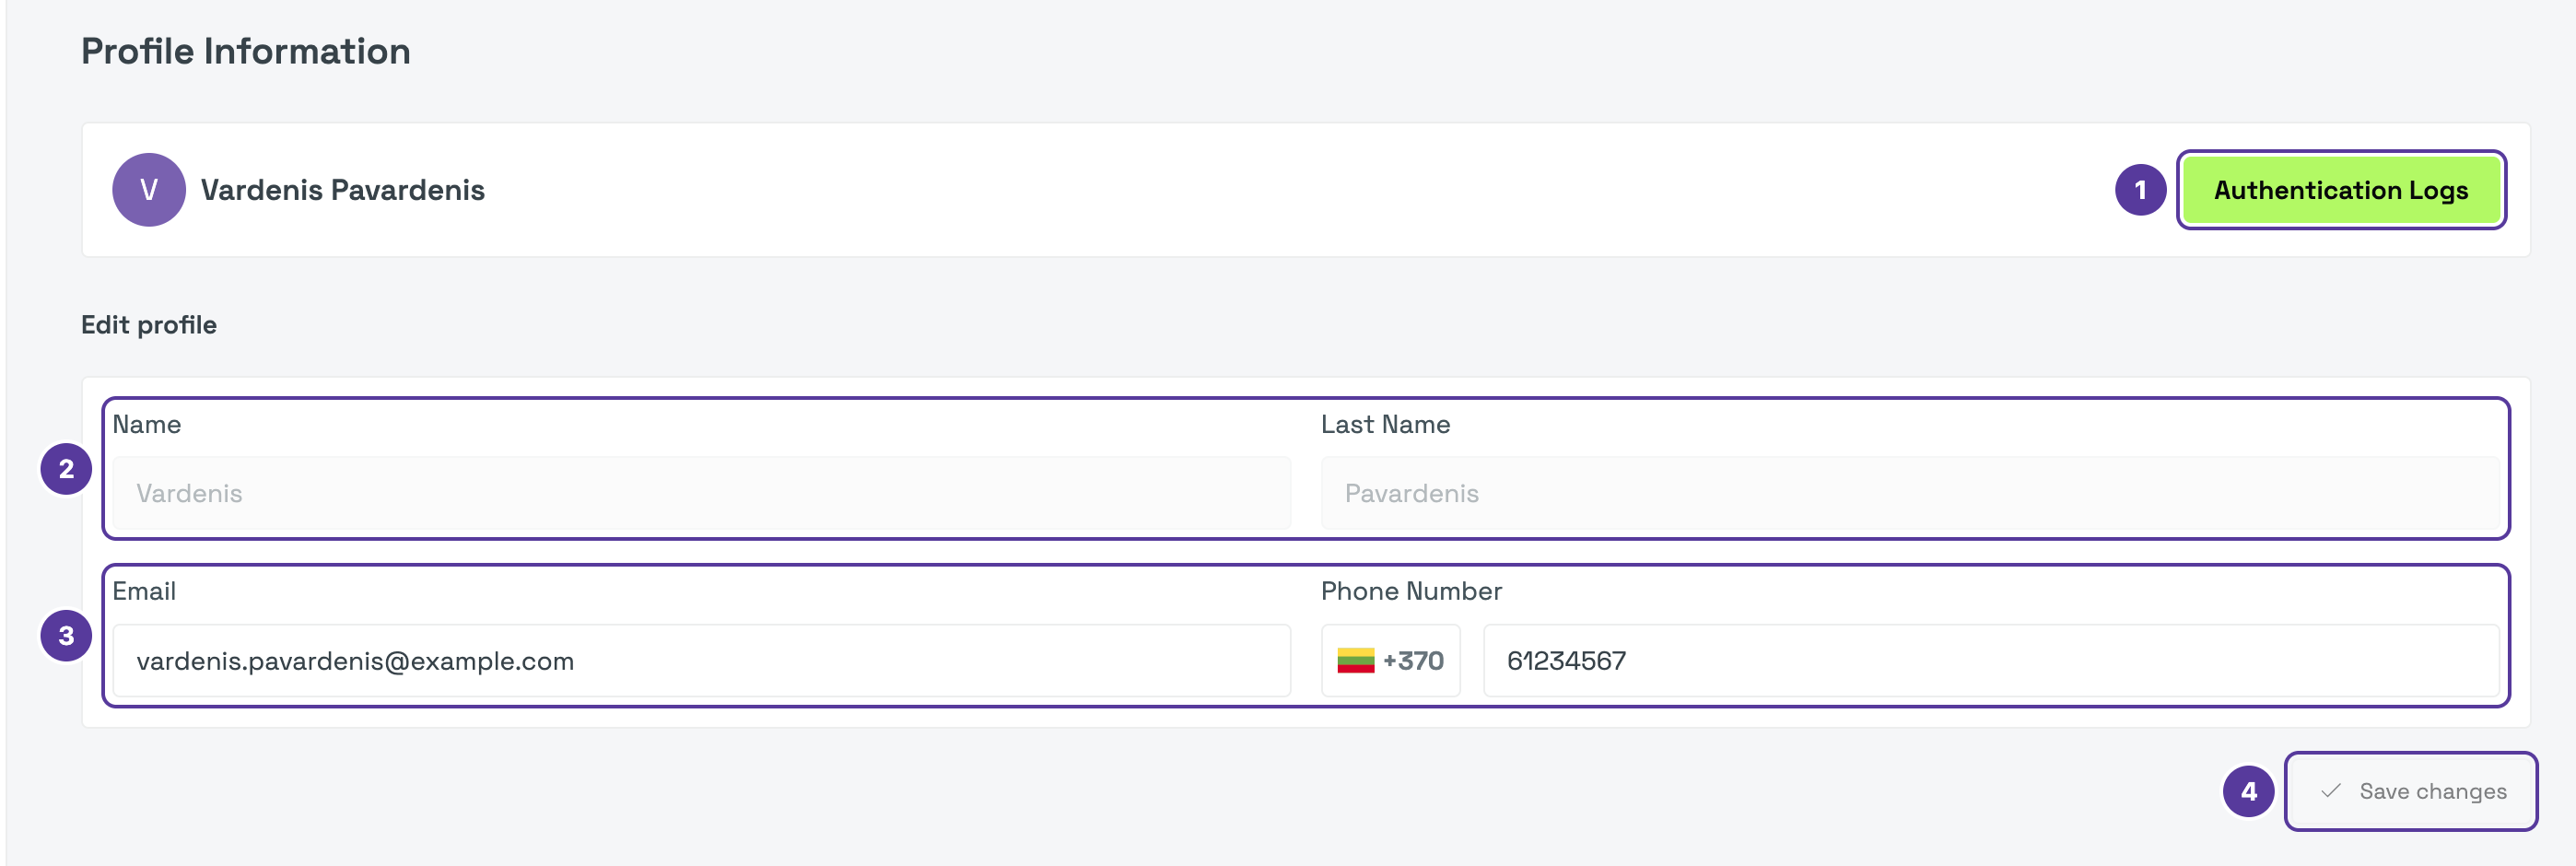
1. **Authentication Logs** — opens the log of your sign-ins.
2. **Name** and **Last Name** — come from the e-Government Gateway and cannot be changed.
3. **Email** and **Phone Number** (with its country code) — you can change these.
4. **Save changes** — becomes active once you change something.
## Sign-in history [#sign-in-history]
**Authentication Logs** has one row per sign-in:
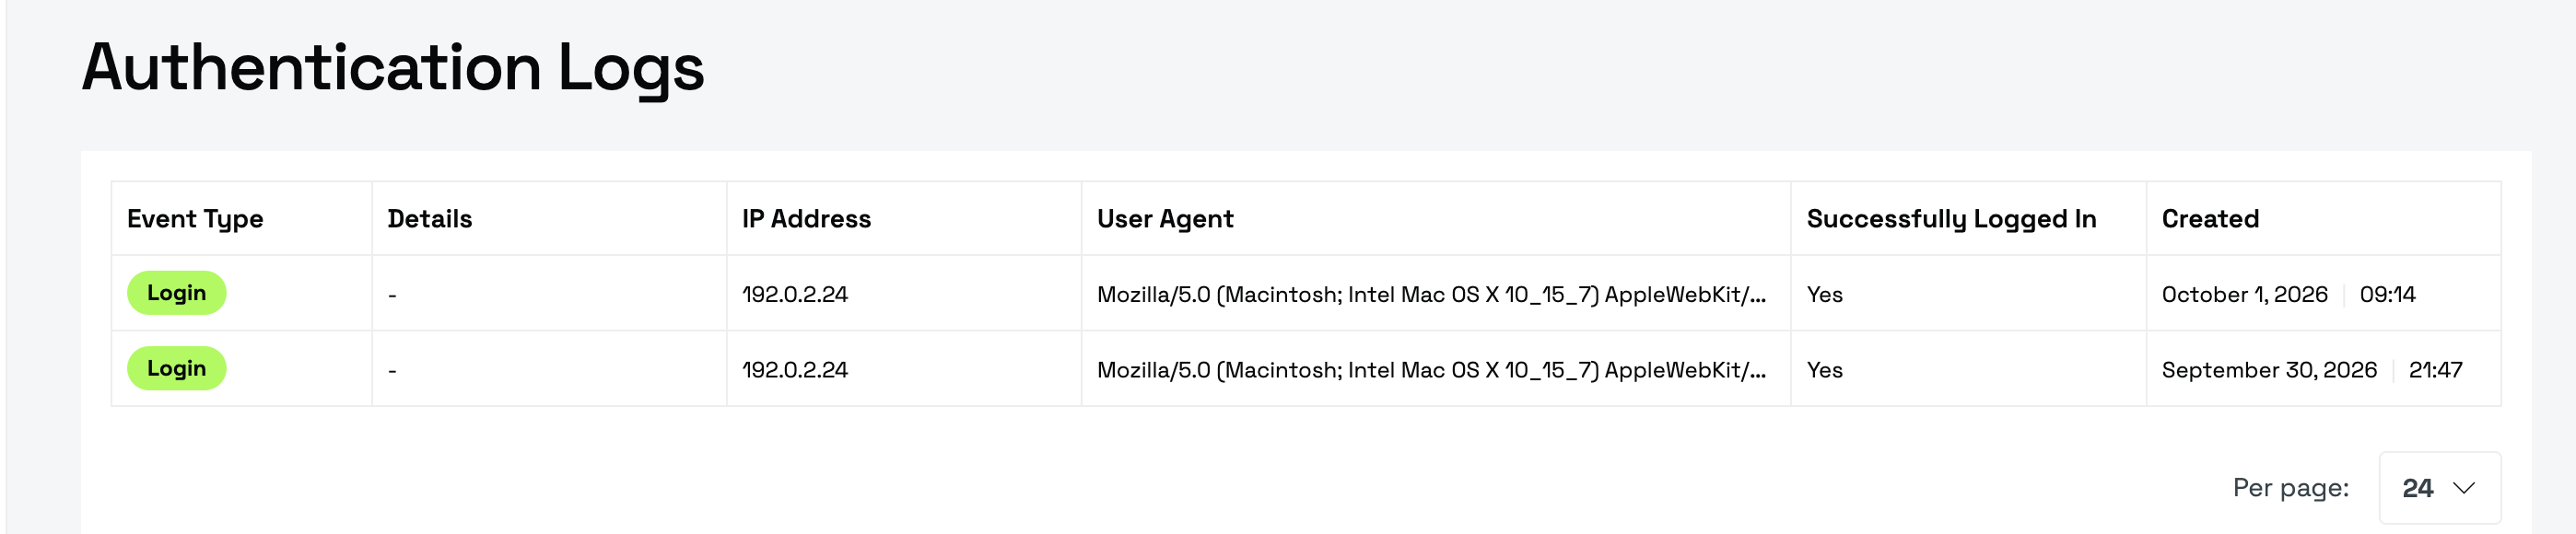
| Column | What it shows |
| --------------------------------- | ------------------------------------------------ |
| **Event Type** | For example, *Login*. |
| **Details** | Extra information, if any. |
| **IP Address** and **User Agent** | Where you signed in from and with which browser. |
| **Successfully Logged In** | *Yes* if the sign-in worked. |
| **Created** | Date and time. |
# Subscription (https://guides.dataportal.gov.lt/docs/guide/subscription)
The portal can email you about data updates and other news. You subscribe from the **Stay up to date** section in the portal footer.
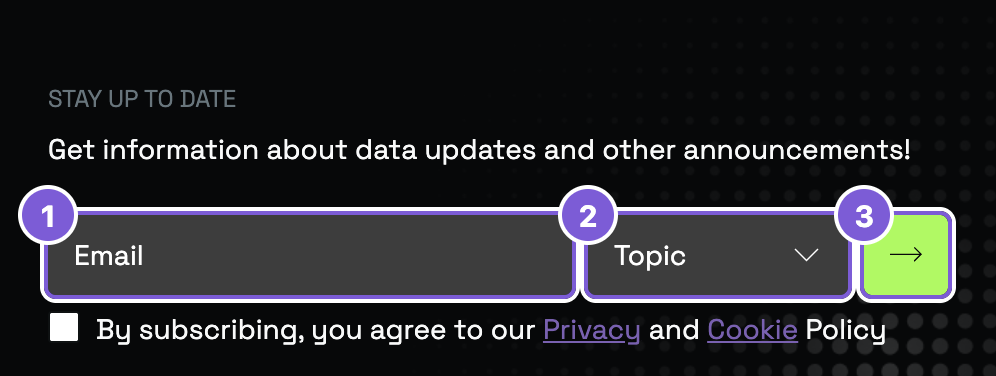
1. **The email field.**
2. **The topic selector.**
3. **The subscribe button.**
Before clicking it, tick the consent checkbox below the fields.
## How to subscribe [#how-to-subscribe]
### Enter your email [#enter-your-email]
In the portal footer, type the address where you want to receive news into the **Email** field.
### Choose a topic [#choose-a-topic]
From the **Topic** list, pick the area you're interested in (for example, *Economy and finance* or *Health*) — you'll get news for that topic only.
### Agree and subscribe [#agree-and-subscribe]
Tick the consent box (this agrees to the Privacy and Cookies policy) and click **Subscribe**.
From then on, the address you gave will receive notices about data updates and news for the topic you chose.
* **One topic per subscription.** Want to follow several areas? Subscribe more than once — once for each topic.
# Portal settings (https://guides.dataportal.gov.lt/docs/guide/portal-settings)
You can adapt the portal to suit you: switch the language and turn on options for easier reading. Both controls are in the top-right corner of the portal.
## Language [#language]
The portal is available in Lithuanian and English. Switch the language with the **language button** at the top — it shows the other language (for example *LT* when you are browsing in English). The same switch is also in the portal footer.
## Accessibility [#accessibility]
Next to the language button is **Accessibility settings** — clicking it opens a panel with readability options:
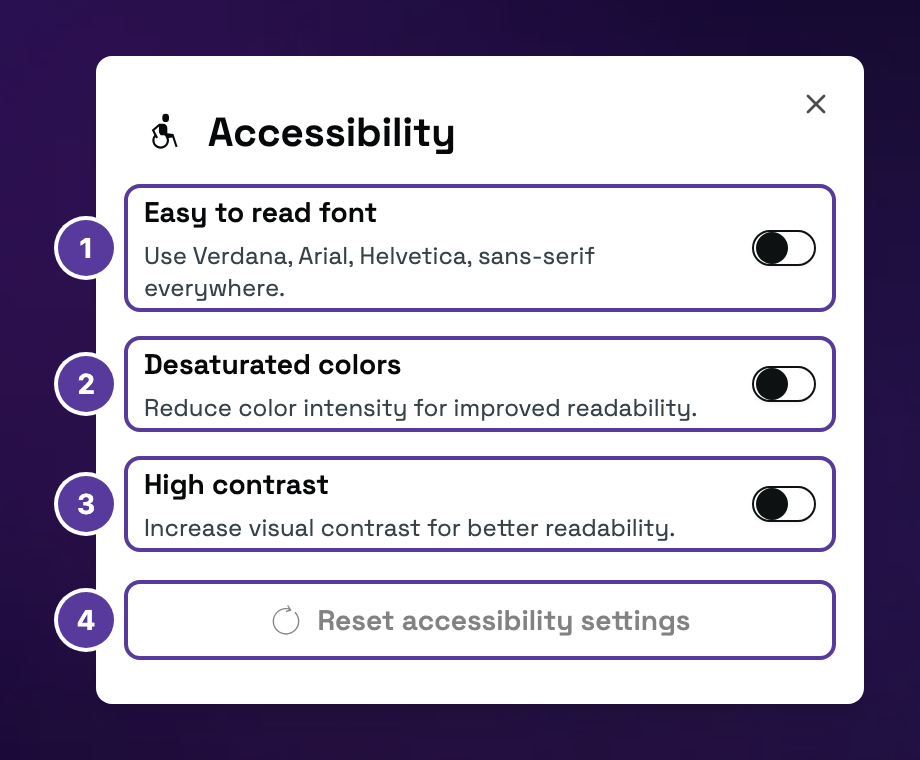
1. **Easy to read font.**
2. **Desaturated colors.**
3. **High contrast.**
4. **Reset accessibility settings.**
| Option | What it does |
| ---------------------- | ----------------------------------------------------------------------------------- |
| **Easy to read font** | Uses an easier-to-read sans-serif font across the site (Verdana, Arial, Helvetica). |
| **Desaturated colors** | Reduces colour intensity for better readability. |
| **High contrast** | Increases visual contrast for better readability. |
Options take effect immediately and stay on as you browse. To return to the default view, click **Reset accessibility settings** in the same panel.
# Data API (https://guides.dataportal.gov.lt/docs/api)
Public, read-only HTTP interface over the Lithuanian Data Portal data lake — Apache Iceberg tables and stored files, queried through Trino. No authentication is required.
Browse namespaces and read table schemas with `GET`; query and export table rows with `POST` (the body only carries the query definition — the API stays read-only). Read rows as JSON, or export whole tables as NDJSON, JSON, CSV, Excel or Parquet. See the Guides for concepts, the real query grammar, and worked examples.
All examples call **[https://api.dataportal.gov.lt](https://api.dataportal.gov.lt)**. The API is public and needs no key or token. For browser apps: the API doesn't send CORS headers, so call it from your own server (or, in these docs, through the built-in proxy).
## Explore by area [#explore-by-area]
## OpenAPI bundle [#openapi-bundle]
Download the full spec (with `servers` injected at runtime) from [`/api/openapi`](https://guides.dataportal.gov.lt/api/openapi). If the API blocks browser CORS, the playground can use the docs `/api/proxy` endpoint.
# Overview (https://guides.dataportal.gov.lt/docs/api/guides/overview)
The **Data API** is a public HTTP interface for reading open data published on the
Lithuanian Data Portal. It exposes the portal's data lake — [Apache Iceberg](https://iceberg.apache.org/)
tables and stored files: browse namespaces and read schemas with `GET`, then
**query** or **export** table rows with `POST`, returning JSON, NDJSON, CSV, Excel
or Parquet.
**No authentication is required** — there are no API keys, tokens or OAuth scopes.
Catalogue and file reads are `GET`; table **queries** and **exports** are `POST`
with a JSON body (the API is still read-only — `POST` only carries the query
definition). All examples use the base URL **`https://api.dataportal.gov.lt`** and
real, live data.
Throughout these guides we use one real dataset —
[**Toxicological test results in death cases**](https://dataportal.gov.lt/lt/datasets/od000503)
(Higienos institutas) — so every example is copy‑pasteable:
## Try it live [#try-it-live]
Pick columns, set a filter, sort and page — then **Run** to call the real API
from your browser. The request is proxied by the docs site so it works despite
the API not sending CORS headers.
## How data is organised [#how-data-is-organised]
The API has three kinds of resource:
* **Namespace** — a container, identified by a dot-separated path. Here the
namespace is the publisher's company code, `111958286`. A namespace holds child
namespaces, tables and files, so the catalogue forms a tree you can walk from
the root down.
* **Table** — an Iceberg table you can inspect (its schema), **query** row by row
as JSON, or **export** in bulk as NDJSON, JSON, CSV, Excel or Parquet.
* **File** — a stored object (PDF, image, archive, …) served straight from object
storage.
## What you can do [#what-you-can-do]
## Quickstart [#quickstart]
### List the root namespaces [#list-the-root-namespaces]
```bash
curl 'https://api.dataportal.gov.lt/namespaces'
```
```json
{ "success": true, "data": { "namespaces": ["111958286", "188774975", "…"] } }
```
### Drill into a namespace [#drill-into-a-namespace]
See its child namespaces, tables and files.
```bash
curl 'https://api.dataportal.gov.lt/namespaces/111958286'
```
```json
{
"success": true,
"data": {
"current_namespace": "111958286",
"child_namespaces": [],
"tables": ["mirusiuju_toksikologinis_rezultatas", "gimimas", "…"],
"files": []
}
}
```
### Inspect the table schema [#inspect-the-table-schema]
Learn the column names and types before you query.
```bash
curl 'https://api.dataportal.gov.lt/namespaces/111958286/tables/mirusiuju_toksikologinis_rezultatas/schema'
```
### Query rows [#query-rows]
Send a JSON body asking for the first 5 rows, newest first, keeping a few columns:
```bash
curl -X POST 'https://api.dataportal.gov.lt/namespaces/111958286/tables/mirusiuju_toksikologinis_rezultatas/query' \
-H 'Content-Type: application/json' \
-d '{"limit":5,"sort":"-mirties_metai","select":"lytis,mirties_metai,pavadinimas"}'
```
```json
{ "data": [ /* … 5 rows … */ ], "total": 22143, "total_pages": 4429, "current_page": 1 }
```
### Export in bulk [#export-in-bulk]
When you want the whole result set as a file rather than paged JSON — the export
endpoint takes the same body plus a `format` query parameter:
```bash
curl -L -o toksikologija.ndjson \
-X POST 'https://api.dataportal.gov.lt/namespaces/111958286/tables/mirusiuju_toksikologinis_rezultatas/export?format=ndjson' \
-H 'Content-Type: application/json' \
-d '{}'
```
## Response format [#response-format]
Catalogue and schema endpoints wrap their payload in a **`{ success, data }`**
envelope. The **query** endpoint is different — it returns the rows plus
offset-based pagination metadata, with no `success` wrapper:
```json
{ "success": true, "data": { "…": "…" } }
```
```json
{ "data": [ /* rows */ ], "total": 22143, "total_pages": 4429, "current_page": 1 }
```
A raw byte stream — NDJSON / JSON / CSV / Parquet, or the file's own content type — not JSON.
Errors carry an `error_code` and a message. See [Errors](https://guides.dataportal.gov.lt/docs/api/guides/errors)
for the exact shapes and status codes (`400`, `404`, `502`, `503`, `504`).
## Where to next [#where-to-next]
## See also [#see-also]
* [Concepts](https://guides.dataportal.gov.lt/docs/api/guides/concepts)
* [Querying tables](https://guides.dataportal.gov.lt/docs/api/guides/querying)
* [Downloading data & files](https://guides.dataportal.gov.lt/docs/api/guides/downloading)
* [Errors](https://guides.dataportal.gov.lt/docs/api/guides/errors)
* [Recipes](https://guides.dataportal.gov.lt/docs/api/guides/recipes)
# Concepts (https://guides.dataportal.gov.lt/docs/api/guides/concepts)
The Data API sits on top of an [Apache Iceberg](https://iceberg.apache.org/) data
lake queried through Trino. Every request is read-only — you browse namespaces and
read schemas with `GET`, and query or export rows with `POST` (the body only
carries the query definition). Five building blocks are worth knowing:
## Namespace [#namespace]
A **namespace** is a container identified by a dot-separated path. In this portal
the namespace is usually the publishing organisation's company code — our example
dataset lives in namespace `111958286` (Higienos institutas).
A namespace lists its **child namespaces**, **tables** and **files**, so the whole
catalogue is a tree you walk from the root:
```json
{
"success": true,
"data": {
"current_namespace": "111958286",
"child_namespaces": [],
"tables": ["mirusiuju_toksikologinis_rezultatas", "gimimas", "…"],
"files": []
}
}
```
Call [`GET /namespaces`](https://guides.dataportal.gov.lt/docs/api/namespaces/listNamespaces) with no path to get
the root list.
## Table [#table]
A **table** is an Iceberg table you can do three things with:
## Schema [#schema]
Before querying, read the table's schema so you know the exact column names and
types. The schema is the Iceberg logical schema: every field has a stable numeric
**id** (Iceberg tracks columns by id across renames), a **type**, and a
**required** (non-nullable) flag.
Here is the real schema of our example table:
Common Iceberg types you will see: `string`, `long`, `int`, `double`, `boolean`,
`date`, `timestamp`, and nested `struct`.
## File [#file]
A **file** is a stored object served straight from object storage — a PDF, image
or archive attached to a namespace. The file name is a single basename (no `/`),
and the response is the raw bytes with the upstream `Content-Type`.
## Snapshot [#snapshot]
Iceberg keeps a history of table **snapshots**. Every write creates a new snapshot
with a numeric `snapshot_id`. The API reads the **latest** snapshot — queries and
exports always reflect the current table state.
## Response envelope [#response-envelope]
Two response shapes exist across the API — keep the distinction in mind:
Namespace and schema endpoints wrap their payload:
```json
{ "success": true, "data": { "…": "…" } }
```
The query endpoint returns rows plus offset pagination metadata — **no** `success` field:
```json
{ "data": [ /* rows */ ], "total": 22143, "total_pages": 4429, "current_page": 1 }
```
Export and file endpoints return raw bytes (NDJSON / JSON / CSV / Excel / Parquet, or the file's content type), not JSON.
## See also [#see-also]
* [Querying tables](https://guides.dataportal.gov.lt/docs/api/guides/querying)
* [Downloading data & files](https://guides.dataportal.gov.lt/docs/api/guides/downloading)
* [Retrieve namespace details or root list](https://guides.dataportal.gov.lt/docs/api/namespaces/listNamespaces)
# Querying tables (https://guides.dataportal.gov.lt/docs/api/guides/querying)
Read rows from a table as JSON with the **query** endpoint. The query is sent as
a JSON request body:
It returns the rows plus offset pagination metadata:
```json
{ "data": [ /* rows */ ], "total": 22143, "total_pages": 4429, "current_page": 1 }
```
## Request body [#request-body]
Send a JSON object. Every field is optional — an empty body `{}` returns the
first page of all columns.
## Select columns [#select-columns]
`select` is a comma-separated projection. Omit it to get every column.
```bash
curl -X POST 'https://api.dataportal.gov.lt/namespaces/111958286/tables/mirusiuju_toksikologinis_rezultatas/query' \
-H 'Content-Type: application/json' \
-d '{"select":"lytis,mirties_metai,pavadinimas","limit":3}'
```
## Filter [#filter]
`filter` is a URL-style expression carried in the body as a string: `column=value`
conditions joined with `&`, optionally using comparison operators and `_and` /
`_or` groups. Values are written **bare** — no quotes needed, even for text with
spaces.
```bash
# Equality — female decedents (5 243 rows)
curl -X POST 'https://api.dataportal.gov.lt/namespaces/111958286/tables/mirusiuju_toksikologinis_rezultatas/query' \
-H 'Content-Type: application/json' \
-d '{"filter":"lytis=Moteris","limit":1}'
```
### Operators [#operators]
Append a **dotted, two-letter** operator to the column. Omit it for equality.
```bash
# Substance name containing "Etan" (13 345 rows)
curl -X POST 'https://api.dataportal.gov.lt/namespaces/111958286/tables/mirusiuju_toksikologinis_rezultatas/query' \
-H 'Content-Type: application/json' \
-d '{"filter":"pavadinimas._co=Etan","limit":1}'
```
The operator names are **two letters**: `._ge` / `._le`, **not** `._gte` / `._lte`.
The three-letter forms are rejected by the query engine (they come back as a
`502`). (Some spec examples show `._gte` — that is a spec bug.)
### Combining conditions — `_and` / `_or` [#combining-conditions--_and--_or]
Join conditions inside the `filter` string with `&`. Each extra condition is
`_and` by default; prefix it with `_or.` for a disjunction. The operator (or none,
for equality) still dots onto the column.
```bash
# 2018+ AND female (4 570 rows)
curl -X POST 'https://api.dataportal.gov.lt/namespaces/111958286/tables/mirusiuju_toksikologinis_rezultatas/query' \
-H 'Content-Type: application/json' \
-d '{"filter":"mirties_metai._ge=2018&_and.lytis=Moteris","limit":1}'
# female OR male
curl -X POST 'https://api.dataportal.gov.lt/namespaces/111958286/tables/mirusiuju_toksikologinis_rezultatas/query' \
-H 'Content-Type: application/json' \
-d '{"filter":"lytis=Moteris&_or.lytis=Vyras","limit":1}'
```
The response `total` reflects the filtered set, so it's the quickest way to check
a filter is doing what you expect.
## Sort [#sort]
`sort` takes comma-separated column names. Prefix `-` for descending, `+` (or
nothing) for ascending.
```bash
# Newest deaths first
curl -X POST 'https://api.dataportal.gov.lt/namespaces/111958286/tables/mirusiuju_toksikologinis_rezultatas/query' \
-H 'Content-Type: application/json' \
-d '{"sort":"-mirties_metai","limit":5}'
```
## Pagination [#pagination]
Pagination is **offset-based** and maps straight to SQL `LIMIT` / `OFFSET`:
* `limit` — page size
* `offset` — rows to skip; `offset = (page − 1) × limit`
The response reports `total` (all matching rows), `total_pages` (for the current
`limit`), and `current_page`.
### First page [#first-page]
```bash
curl -X POST '…/query' -H 'Content-Type: application/json' -d '{"limit":100,"offset":0}'
```
### Next page [#next-page]
Add `limit` to the offset each time — page 2 is `offset=100`, page 3 `offset=200`, …
```bash
curl -X POST '…/query' -H 'Content-Type: application/json' -d '{"limit":100,"offset":100}'
```
### Stop [#stop]
When `current_page` reaches `total_pages` (or fewer than `limit` rows come back), you're done.
### Walk every page [#walk-every-page]
A copy-paste loop that pages through the whole table until the last (short) page:
```bash
URL='https://api.dataportal.gov.lt/namespaces/111958286/tables/mirusiuju_toksikologinis_rezultatas/query'
LIMIT=1000
OFFSET=0
while :; do
RESP=$(curl -s -X POST "$URL" -H 'Content-Type: application/json' \
-d "{\"limit\":$LIMIT,\"offset\":$OFFSET,\"sort\":\"_id\"}")
COUNT=$(echo "$RESP" | jq '.data | length')
echo "offset=$OFFSET got=$COUNT total=$(echo "$RESP" | jq '.total')"
[ "$COUNT" -lt "$LIMIT" ] && break # last page: fewer than limit rows
OFFSET=$((OFFSET + LIMIT))
done
```
```python
import requests
URL = "https://api.dataportal.gov.lt/namespaces/111958286/tables/mirusiuju_toksikologinis_rezultatas/query"
limit, offset = 1000, 0
while True:
resp = requests.post(URL, json={"limit": limit, "offset": offset, "sort": "_id"}).json()
rows = resp["data"]
print(f"offset={offset} got={len(rows)} total={resp['total']}")
if len(rows) < limit:
break # last page
offset += limit
```
```js
const URL = "https://api.dataportal.gov.lt/namespaces/111958286/tables/mirusiuju_toksikologinis_rezultatas/query";
const limit = 1000;
let offset = 0;
while (true) {
const resp = await (await fetch(URL, {
method: "POST",
headers: { "Content-Type": "application/json" },
body: JSON.stringify({ limit, offset, sort: "_id" }),
})).json();
console.log(`offset=${offset} got=${resp.data.length} total=${resp.total}`);
if (resp.data.length < limit) break; // last page
offset += limit;
}
```
* **Always add a stable `sort`** (e.g. `sort=_id`). Without a fixed order the query
engine may return rows differently between requests, so offset paging can skip or
repeat rows. A `filter` shrinks `total`, so you page the filtered set.
* **Deep offsets get slow** — `OFFSET` still scans the rows it skips. To pull the
whole table, don't paginate at all: use the
[export endpoint](https://guides.dataportal.gov.lt/docs/api/guides/downloading), which streams the entire
result set in one request.
## Drop null rows [#drop-null-rows]
`exclude_nulls` names one or more columns that must be non-null; rows with a null
in any of them are dropped from the result. Pass it as a JSON array:
```bash
curl -X POST '…/query' -H 'Content-Type: application/json' \
-d '{"exclude_nulls":["m_konc","pavadinimas"],"limit":5}'
```
## Try it [#try-it]
Build a query against the live table and run it:
## See also [#see-also]
* [Concepts](https://guides.dataportal.gov.lt/docs/api/guides/concepts)
* [Errors](https://guides.dataportal.gov.lt/docs/api/guides/errors)
* [Recipes](https://guides.dataportal.gov.lt/docs/api/guides/recipes)
* [Query table rows](https://guides.dataportal.gov.lt/docs/api/tables/queryTable)
# Downloading data & files (https://guides.dataportal.gov.lt/docs/api/guides/downloading)
The **query** endpoint is for reading rows page by page as JSON. When you want the
**whole result set as a file**, use the **export** endpoint instead — it streams
the data in your chosen format with no pagination.
Export takes the **same JSON request body** as the [query endpoint](https://guides.dataportal.gov.lt/docs/api/guides/querying)
— `select`, `filter`, `sort`, `limit`, `offset`, `exclude_nulls` — so any query you
build can be exported. The only extra is a **`format`** query parameter that picks
the file type. Omit the body (`{}`) to export the whole table.
## Formats [#formats]
Set the `format` query parameter. `ndjson` is the default:
```bash
# Whole table as NDJSON
curl -L -o toksikologija.ndjson \
-X POST 'https://api.dataportal.gov.lt/namespaces/111958286/tables/mirusiuju_toksikologinis_rezultatas/export?format=ndjson' \
-H 'Content-Type: application/json' \
-d '{}'
```
```json
{"_id":"11939610733872445230","vda_id":"166d143f8929ba0","pavadinimas":"Etanolis (etilo alkoholis)","lytis":"Moteris","mirties_metai":2021, …}
{"_id":"00016506519020014367","vda_id":"4f277520b7ccca2","pavadinimas":"Etanolis (etilo alkoholis)","lytis":"Vyras","mirties_metai":2019, …}
```
Swap `format=csv`, `format=json`, `format=xlsx` or `format=parquet` for a different
file type and change the output filename to match. The `xlsx` (Excel) format is
capped at **1,000,000 rows** — narrow the export with a `filter` or `limit` for
tables larger than that.
## Selected columns & filters [#selected-columns--filters]
Because export shares the query body, narrow the export with `select` and `filter`
exactly as you would a query — the [querying guide](https://guides.dataportal.gov.lt/docs/api/guides/querying)
documents the full filter grammar:
```bash
# Only three columns, female decedents, as NDJSON
curl -L -o subset.ndjson \
-X POST 'https://api.dataportal.gov.lt/namespaces/111958286/tables/mirusiuju_toksikologinis_rezultatas/export?format=ndjson' \
-H 'Content-Type: application/json' \
-d '{"select":"lytis,mirties_metai,pavadinimas","filter":"lytis=Moteris"}'
```
## Request body [#request-body]
`format` goes on the URL as a query string (`?format=ndjson`), not in the JSON
body. The body carries only the query fields above.
## Downloading files [#downloading-files]
Stored files (PDFs, images, archives) attached to a namespace are downloaded by
name. The file name is a single basename — it must not contain `/`.
```bash
curl -L -O 'https://api.dataportal.gov.lt/namespaces/{namespace}/files/report.pdf'
```
The response is the raw bytes with the upstream `Content-Type` and filename
preserved.
## See also [#see-also]
* [Querying tables](https://guides.dataportal.gov.lt/docs/api/guides/querying)
* [Errors](https://guides.dataportal.gov.lt/docs/api/guides/errors)
* [Export table rows](https://guides.dataportal.gov.lt/docs/api/tables/exportTable)
* [Download a file from object storage](https://guides.dataportal.gov.lt/docs/api/files/downloadFile)
# Recipes (https://guides.dataportal.gov.lt/docs/api/guides/recipes)
Short, working answers to common questions, all against the live example table
`mirusiuju_toksikologinis_rezultatas` in namespace `111958286`. Swap in your own
namespace and table and they keep working.
## Count how many rows match — without downloading them [#count-how-many-rows-match--without-downloading-them]
Ask for one row and read `total`; it reflects the **filtered** set, so it's the
cheapest way to size a query.
```bash
curl -s -X POST 'https://api.dataportal.gov.lt/namespaces/111958286/tables/mirusiuju_toksikologinis_rezultatas/query' \
-H 'Content-Type: application/json' \
-d '{"filter":"lytis=Moteris","limit":1}' | jq '.total'
```
```python
import requests
URL = "https://api.dataportal.gov.lt/namespaces/111958286/tables/mirusiuju_toksikologinis_rezultatas/query"
total = requests.post(URL, json={"filter": "lytis=Moteris", "limit": 1}).json()["total"]
print(total, "rows match")
```
```js
const URL = "https://api.dataportal.gov.lt/namespaces/111958286/tables/mirusiuju_toksikologinis_rezultatas/query";
const { total } = await fetch(URL, {
method: "POST",
headers: { "Content-Type": "application/json" },
body: JSON.stringify({ filter: "lytis=Moteris", limit: 1 }),
}).then((r) => r.json());
console.log(total, "rows match");
```
## Get only the columns you need [#get-only-the-columns-you-need]
```bash
curl -X POST '…/query' -H 'Content-Type: application/json' \
-d '{"select":"lytis,mirties_metai,pavadinimas","limit":20}'
```
## Filter three ways [#filter-three-ways]
```bash
# Exact match
-d '{"filter":"lytis=Moteris"}'
# Range — deaths in 2018 or later
-d '{"filter":"mirties_metai._ge=2018"}'
# Contains — substance name includes "Etan"
-d '{"filter":"pavadinimas._co=Etan"}'
```
## Combine conditions (AND / OR) [#combine-conditions-and--or]
Join conditions inside the `filter` string with `&`; each extra one is `_and` by
default, or prefix `_or.` for a disjunction.
```bash
# 2018+ AND female
-d '{"filter":"mirties_metai._ge=2018&_and.lytis=Moteris"}'
# female OR male
-d '{"filter":"lytis=Moteris&_or.lytis=Vyras"}'
```
## Newest first [#newest-first]
```bash
curl -X POST '…/query' -H 'Content-Type: application/json' \
-d '{"sort":"-mirties_metai","limit":10}'
```
## Page through the whole table [#page-through-the-whole-table]
Always add a stable `sort` (e.g. `_id`) so offset paging doesn't skip or repeat
rows. Stop when a page returns fewer than `limit` rows.
```python
import requests
URL = "https://api.dataportal.gov.lt/namespaces/111958286/tables/mirusiuju_toksikologinis_rezultatas/query"
limit, offset = 1000, 0
rows = []
while True:
page = requests.post(URL, json={"limit": limit, "offset": offset, "sort": "_id"}).json()["data"]
rows += page
if len(page) < limit:
break
offset += limit
print(len(rows), "rows total")
```
```js
const URL = "https://api.dataportal.gov.lt/namespaces/111958286/tables/mirusiuju_toksikologinis_rezultatas/query";
const limit = 1000;
let offset = 0, rows = [];
while (true) {
const page = await fetch(URL, {
method: "POST",
headers: { "Content-Type": "application/json" },
body: JSON.stringify({ limit, offset, sort: "_id" }),
}).then((r) => r.json());
rows.push(...page.data);
if (page.data.length < limit) break;
offset += limit;
}
console.log(rows.length, "rows total");
```
For a full dump, don't page at all — the [export endpoint](https://guides.dataportal.gov.lt/docs/api/guides/downloading)
streams the entire result set in one request.
## Export the whole table to Excel [#export-the-whole-table-to-excel]
`xlsx` is capped at 1,000,000 rows; filter or `limit` larger tables.
```bash
curl -L -o toksikologija.xlsx \
-X POST 'https://api.dataportal.gov.lt/namespaces/111958286/tables/mirusiuju_toksikologinis_rezultatas/export?format=xlsx' \
-H 'Content-Type: application/json' -d '{}'
```
## Export just a filtered slice [#export-just-a-filtered-slice]
Export shares the query body, so any filter you can query, you can export:
```bash
curl -L -o moterys.csv \
-X POST '…/export?format=csv' -H 'Content-Type: application/json' \
-d '{"select":"lytis,mirties_metai,pavadinimas","filter":"lytis=Moteris"}'
```
## Download a stored file [#download-a-stored-file]
```bash
curl -L -O 'https://api.dataportal.gov.lt/namespaces/{namespace}/files/report.pdf'
```
## See also [#see-also]
* [Querying tables](https://guides.dataportal.gov.lt/docs/api/guides/querying)
* [Downloading data & files](https://guides.dataportal.gov.lt/docs/api/guides/downloading)
* [Errors](https://guides.dataportal.gov.lt/docs/api/guides/errors)
* [Concepts](https://guides.dataportal.gov.lt/docs/api/guides/concepts)
# Errors (https://guides.dataportal.gov.lt/docs/api/guides/errors)
The API uses standard HTTP status codes. `2xx` means success; anything else
carries an error body, and the **body shape depends on which layer failed**. Pick
a status code below to see when it happens, exactly what comes back, and how to
handle it.
* **`{ message, error_code }`** — the data layer (e.g. a `404` for a missing table).
* **`{ error, error_code }`** — the application error object documented in the OpenAPI spec.
* **`error code: NNN`** (plain text) — a gateway-level `5xx` that never reached the application.
* **RFC 9110 problem document** — request validation (`400` / `422`), with bad fields under `errors`.
When present, read `error_code` for a stable machine-readable reason and fall back
to the human message.
## The one that surprises people [#the-one-that-surprises-people]
A **malformed `filter` or an unknown column returns `502`, not `400`.** The filter
is passed straight to the query engine, so the engine — not the request validator —
is what rejects it. So:
* Bad operator (`._gte`) or bad column name → **502**, body `error code: 502`.
* Bad value type (`limit: "abc"`) → **400**, the RFC problem document above.
See [Querying](https://guides.dataportal.gov.lt/docs/api/guides/querying) for the exact filter grammar.
## Handling errors [#handling-errors]
* **Check the status code first**, then parse the body by the shapes above.
* `404` is normal while browsing — a namespace may simply have no such table.
* For `502` / `503` / `504`, retry with backoff — but first rule out a bad query
(they are the same code the engine returns for an invalid filter).
## See also [#see-also]
* [Querying tables](https://guides.dataportal.gov.lt/docs/api/guides/querying)
* [Downloading data & files](https://guides.dataportal.gov.lt/docs/api/guides/downloading)
* [Recipes](https://guides.dataportal.gov.lt/docs/api/guides/recipes)
# Retrieve namespace details or root list (https://guides.dataportal.gov.lt/docs/api/namespaces/listNamespaces)
{/* This file was generated by Fumadocs. Do not edit this file directly. Any changes should be made by running the generation command again. */}
## See also [#see-also]
* [Concepts](https://guides.dataportal.gov.lt/docs/api/guides/concepts)
# Retrieve namespace details (https://guides.dataportal.gov.lt/docs/api/namespaces/getNamespace)
{/* This file was generated by Fumadocs. Do not edit this file directly. Any changes should be made by running the generation command again. */}
## See also [#see-also]
* [Concepts](https://guides.dataportal.gov.lt/docs/api/guides/concepts)
# Get table schema (https://guides.dataportal.gov.lt/docs/api/tables/getTableSchema)
{/* This file was generated by Fumadocs. Do not edit this file directly. Any changes should be made by running the generation command again. */}
## See also [#see-also]
* [Concepts](https://guides.dataportal.gov.lt/docs/api/guides/concepts)
* [Querying tables](https://guides.dataportal.gov.lt/docs/api/guides/querying)
# Query table rows (https://guides.dataportal.gov.lt/docs/api/tables/queryTable)
{/* This file was generated by Fumadocs. Do not edit this file directly. Any changes should be made by running the generation command again. */}
## See also [#see-also]
* [Querying tables](https://guides.dataportal.gov.lt/docs/api/guides/querying)
* [Errors](https://guides.dataportal.gov.lt/docs/api/guides/errors)
# Export table rows (https://guides.dataportal.gov.lt/docs/api/tables/exportTable)
{/* This file was generated by Fumadocs. Do not edit this file directly. Any changes should be made by running the generation command again. */}
## See also [#see-also]
* [Downloading data & files](https://guides.dataportal.gov.lt/docs/api/guides/downloading)
* [Errors](https://guides.dataportal.gov.lt/docs/api/guides/errors)
# Download a file from object storage (https://guides.dataportal.gov.lt/docs/api/files/downloadFile)
{/* This file was generated by Fumadocs. Do not edit this file directly. Any changes should be made by running the generation command again. */}
## See also [#see-also]
* [Downloading data & files](https://guides.dataportal.gov.lt/docs/api/guides/downloading)
* [Concepts](https://guides.dataportal.gov.lt/docs/api/guides/concepts)
# Using the docs with AI assistants (https://guides.dataportal.gov.lt/docs/mcp)
Connect this documentation to your AI assistant — *Claude*, *ChatGPT*, *Copilot*, *Cursor* or another. Then, when you ask about the portal, the assistant looks the answer up in this guide and links to the page.
* **No sign-in.** The server is public; no keys needed.
* **Read-only.** The assistant searches and reads, and changes nothing.
* **Always current.** The same content you see on the site.
## What is MCP? [#what-is-mcp]
**MCP** (*Model Context Protocol*) is an open standard that AI assistants use to connect to outside sources and tools. *Anthropic* introduced it in 2024, and most major AI tools now support it. The name is worth unpacking:
The language model — the assistant's “brain”. It knows a lot, but only what it learned up to a certain date.
The information the model sees while answering. The better the context, the better the answer.
Shared rules for how the model talks to an outside source: what to ask and what answer to expect.
MCP is often compared to a *USB-C* port: one plug fits many devices. Likewise, this documentation is connected once, and any assistant that supports MCP can use it.
**Why does it matter?** Without a source to check, an assistant answers from memory. The portal may have changed since the model was trained, and it may simply invent a button label or an API parameter. With MCP, the assistant checks this guide first and backs its answer with a link you can open yourself:
“How do I download only the filtered rows?”
It searches this documentation over MCP.
It gets the current text of the guide.
The answer is based on the guide — you can check it.
## How to connect [#how-to-connect]
On *claude.ai* or in the *Claude* app:
Open **Settings → Connectors** and click **Add custom connector**.
Enter a name (for example, *LDP documentation*) and the server address `https://guides.dataportal.gov.lt/api/mcp`. Leave the authentication fields empty.
Click **Add**. In a chat, turn the connector on from the **+** button or the tools menu.
Whether you can add custom connectors depends on your *Claude* plan and your organisation's settings.
In a terminal:
```bash
claude mcp add --transport http ldp-docs https://guides.dataportal.gov.lt/api/mcp
```
Check it with `claude mcp list`, or with `/mcp` inside a session.
Open **Settings → Apps & Connectors → Advanced settings** and turn on **Developer mode**.
Back in **Apps & Connectors**, click **Create**, enter a name and the server address, and choose **No authentication**.
In a chat, pick the connector from the **+** button.
Developer mode is not available on every *ChatGPT* plan.
In `.cursor/mcp.json` (for one project) or `~/.cursor/mcp.json` (for all projects):
```json
{
"mcpServers": {
"ldp-docs": {
"url": "https://guides.dataportal.gov.lt/api/mcp"
}
}
}
```
Then check under **Cursor Settings → MCP** that the server is enabled.
With *GitHub Copilot* — in `.vscode/mcp.json`:
```json
{
"servers": {
"ldp-docs": {
"type": "http",
"url": "https://guides.dataportal.gov.lt/api/mcp"
}
}
}
```
Or run **MCP: Add Server** from the command palette and enter the address. The tools are available in *Copilot Chat*'s agent mode.
Any application that supports MCP over **Streamable HTTP** works — give it the server address.
If an application only supports local (*stdio*) servers, use the `mcp-remote` bridge (requires *Node.js*):
```json
{
"mcpServers": {
"ldp-docs": {
"command": "npx",
"args": ["-y", "mcp-remote", "https://guides.dataportal.gov.lt/api/mcp"]
}
}
}
```
## What to ask [#what-to-ask]
Once connected, just ask — the assistant decides when to look things up in the documentation:
How do I download only the filtered rows as XLSX from dataportal.gov.lt?
What does a dash mean in the data table?
How do I find the next releases in the release calendar and add a date to my own calendar?
Write Python that fetches every row of a table through the API, not just the first page.
The documentation search covers both the Lithuanian and the English text of every page and answers in the language you ask in — even when your question uses a term from the other language, such as a button label from the Lithuanian portal. The portal's official statistics are published in both Lithuanian and English, so you can search for and download the data in whichever language suits you.
## The assistant's tools [#the-assistants-tools]
The server gives the assistant three tools. They cover both the [user guide](https://guides.dataportal.gov.lt/docs/guide) and the [Data API documentation](https://guides.dataportal.gov.lt/docs/api), in both languages.
Searches the documentation — the same search as on the site, over both languages; returns pages in the language of the question.
Reads a whole page — the text, tables and the descriptions of screenshots.
Lists every page, in the same order as the menu.
## Privacy [#privacy]
The server needs no sign-in and sets no cookies. It only reads the public documentation.
* **What reaches the server** is only what the assistant puts into a tool call — the search words or the page address — not your conversation.
* **What is kept:** when a search or page lookup finds nothing, its words and language are logged, with nothing about who asked, so that missing topics can be added to the documentation.
* As with any page on this site, the servers keep standard technical access logs.
Your conversation itself is handled by your AI assistant's provider, under its terms. More in the portal's [privacy policy](https://dataportal.gov.lt/en/privacy-policy).
## Without MCP [#without-mcp]
If your tool does not support MCP, you can still hand it the documentation:
The **Copy Markdown** button at the top of the page. Or add `.mdx` to a page's address.
[`llms.txt`](https://guides.dataportal.gov.lt/llms.txt) — every page with a short description and a link.
[`llms-full.txt`](https://guides.dataportal.gov.lt/llms-full.txt?lang=en) — the whole documentation in English. Also in [Lithuanian](https://guides.dataportal.gov.lt/llms-full.txt?lang=lt).
* **Want to try the server yourself?** Run `npx @modelcontextprotocol/inspector`, choose **Streamable HTTP**, enter the server address and call the tools directly.
* **The assistant doesn't use it?** Ask explicitly: “search the dataportal documentation”.